Marine Evidence based Sensitivity Assessment (MarESA) - summary
The MarESA approach is summarised below. Detailed guidance on the application of the MarESA approach is provided in Tyler-Walters et al. (2023).
General concepts
The 'concept' of sensitivity has been developed over many decades and applied in coastal and marine habitats. Numerous approaches have been developed and applied at a range of spatial scales, and to a variety of management questions (see Roberts et al., 2010).
The most common approaches define 'sensitivity' as a product of:
-
the likelihood of damage (termed intolerance or resistance) due to a pressure;
-
the rate of (or time taken for) recovery (termed recoverability, or resilience) once the pressure has abated or been removed.
Or in other words "a species (population) is defined as very sensitive when it is easily adversely affected by human activity (e.g. low resistance) and recovery is only achieved after a prolonged period, if at all (e.g. low resilience or recoverability)" (OSPAR, 2008; Laffoley et al., 2000).
Sensitivity is an inherent characteristic determined by the biology/ecology of the feature (species or habitat) in question. But it is a 'relative' concept as it depends on the degree (expressed as magnitude, extent, frequency or duration) of the effect on the feature. Therefore, sensitivity assessment uses a variety of standardized thresholds, categories and ranks to ensure that the assessments of ‘relative’ sensitivity compare ‘like with like’. These are:
- standard categories of human activities and natural events, and their resultant ‘pressures’ on the environment.
- descriptors of the nature of the pressure (i.e. type of pressure, e.g. temperature change, physical disturbance or oxygen depletion).
- descriptors of the pressure (e.g. magnitude, extent, duration and frequency of the effect) termed the pressure benchmark;
- descriptors of resultant change or damage (intolerance/resistance) (i.e. the proportion of species population lost, area of habitat lost/damaged);
- categories or ranks of recovery (recoverability or resilience) thought to be significant, and
- resultant ranks of sensitivity and, or, vulnerability.
Common terms used in sensitivity assessment are defined in Table 1.
|
Term |
Definition |
Sources |
|---|---|---|
|
Sensitivity |
The intolerance of a species or habitat to damage from an external factor and the time taken for its subsequent recovery. Or The likelihood of change when a pressure is applied to a feature (receptor) and is a function of the ability of the feature to tolerate or resist change (resistance) and its ability to recover from impact (resilience). |
Laffoley et al. (2000); Tyler-Walters & Hiscock (2005). Tillin et al. (2010), Tillin & Hull (2003), Tillin & Tyler-Walters (2014) |
|
Resistance (Intolerance) |
Resistance characteristics indicate whether a receptor can absorb disturbance or stress without changing character. |
Holling (1973) |
|
Resilience (Recoverability) |
The ability of a receptor to recover from disturbance or stress. |
Holling (1973) |
|
Pressure |
The mechanism through which an activity has an effect on any part of the ecosystem. The nature of the pressure is determined by activity type, intensity and distribution. |
Robinson et al. (2008) |
|
Exposure |
The action of a pressure on a receptor, with regard to the extent, magnitude and duration of the pressure. |
Robinson et al. (2008) |
|
Vulnerability |
Vulnerability is a measure of the degree of exposure of a receptor to a pressure to which it is sensitive. |
Hiscock et al. 1999; Oakwood Environmental Ltd (2002). |
Marine Evidence-based Sensitivity Assessment (MarESA) approach
MarESA sensitivity assessment involves a systematic process to examine the biology or ecology of a feature, compile the evidence of the effect of a given pressure on the feature (species or habitat) in question, assess the likely sensitivity of the feature to the pressure against standard scales, and to document the evidence used and justify assessments made. ‘Feature’ is a generic term. Features can be single species, groups of species, single biotopes, or ‘habitats’ composed of (or defined by) a number of biotopes and/or component species. Note - the MarESA approach supersedes and replaces the MarLIN approach.
MarESA sensitivity assessment involves the following steps (see Figure 1).
- Literature/evidence review
- Define the key elements of the feature (in terms of life history, and ecology of the key and characterizing species);
- Assess the feature's resistance to a defined intensity of pressure (the pressure benchmark);
- Assess the feature's resilience based on its ecology;
- Combine resistance and resilience to derive an overall sensitivity score;
- Assess the confidence in the sensitivity assessments;
- Document the evidence used and any considerations around application; and
- Undertake quality assurance and peer review.
Figure 1. Overview of the sensitivity assessment process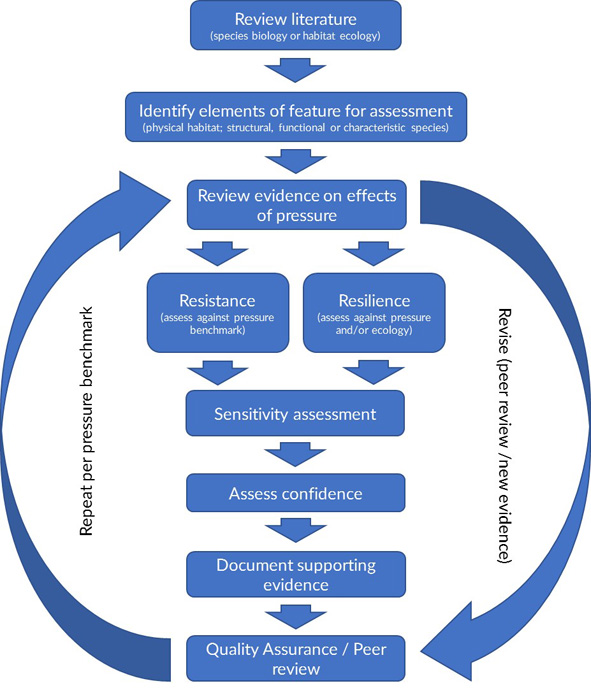
1. Literature/ evidence review
The literature review uses a simplified Rapid Evidence Assessment (REA) approach. A systematic approach is used based on a defined list of keywords and search terms. The ‘literature review’ and the ‘definition of key elements of the feature’ are undertaken simultaneously. The physical habitat, the characteristic species, and their relative contribution to similarity and/or ecological structure and function are considered in the ‘definition of the key elements of the feature’ for habitats or biotopes. The literature review is time limited and focused on the key elements of the feature (species/habitat) as identified below. The review uses the library services provided by the National Marine Biological Library (NMBL).
2. Key elements of the feature
In order to assess sensitivity, elements of the features must be selected as the basis of the assessment. The assessment of sensitivity should be guided by the presence of key structural or functional species/assemblages and/or those that characterize the biotope groups. The species (or assemblages) which are regarded as key structural or functional species should be identified and a full audit trail provided. The types of species that should be identified for the habitat assessments are provided in Table 2. Physical and chemical characteristics are also considered where these structure the community.
|
Category |
Description |
|---|---|
|
Key structural species |
The species provides a distinct habitat that supports an associated community. Loss or degradation of this species' population would result in loss or degradation of the associated community. |
|
Key functional species |
Species that maintain community structure and function through interactions with other members of that community (for example through predation, or grazing). Loss or degradation of this species' population would result in rapid, cascading changes in the community. |
|
Important characteristic species |
Species characteristic of the biotope (dominant, and frequent) and important for the classification of the habitat. Loss or degradation of this species' population may result in changes in habitat classification. |
3 & 4. Resistance and resilience assessment
The resistance and resilience of the feature are assessed against each pressure using the available evidence. A standard list of pressures, pressure descriptions and 'benchmark' levels of each pressure have been developed. The benchmarks are designed to provide a ‘standard’ level of pressure against which to assess resistance/resilience. The assessment scales used for resistance and resilience are given in Tables 3 and 4 respectively.
|
Resistance |
Description |
|---|---|
|
None |
Key functional, structural, characterizing species severely decline and/or physicochemical parameters are also affected e.g. removal of habitats causing a change in habitat type. A severe decline/reduction relates to the loss of 75% of the extent, density or abundance of the selected species or habitat component e.g. loss of 75% substratum (where this can be sensibly applied). |
|
Low |
Significant mortality of key and characterizing species with some effects on the physicochemical character of habitat. A significant decline/reduction relates to the loss of 25-75% of the extent, density, or abundance of the selected species or habitat component e.g. loss of 25-75% of the substratum. |
|
Medium |
Some mortality of species (can be significant where these are not keystone structural/functional and characterizing species) without change to habitats relates to the loss of <25% of the species or habitat component. |
|
High |
No significant effects on the physicochemical character of the habitat and no effect on the population viability of key/characterizing species but may affect feeding, respiration and reproduction rates. |
|
Resilience |
Description |
|---|---|
|
Very Low |
Negligible or prolonged recovery possible; at least 25 years to recover structure and function |
|
Low |
Full recovery within 10-25 years |
|
Medium |
Full recovery within 2-10 years |
|
High |
Full recovery within 2 years |
‘Full recovery’ is envisaged as a return to the state of the habitat that existed prior to impact. However, this does not necessarily mean that every component species has returned to its prior condition, abundance or extent but that the relevant functional components are present and the habitat is structurally and functionally recognizable as the initial habitat of interest.
5. Overall sensitivity assessment
The resistance and resilience scores are combined, as follows, to give an overall sensitivity score as shown in Table 5.
|
|
Resistance |
|||
|---|---|---|---|---|
|
Resilience |
None |
Low |
Medium |
High |
|
Very low |
High |
High |
Medium |
Low |
|
Low |
High |
High |
Medium |
Low |
|
Medium |
Medium |
Medium |
Medium |
Low |
|
High |
Medium |
Low |
Low |
Not sensitive |
Not sensitive - is recorded where the habitat or species has a ‘High’ resistance (and hence is likely to recover quickly i.e. a ‘High’ resilience) at the benchmark level of pressure. In the text, this is denoted by the phrase 'Not sensitive at the benchmark level'. It should be noted that the species or habitat might be sensitive at pressure levels higher than the benchmark (i.e. where the pressure is of greater intensity, magnitude, or duration).
The following terms are used to explain if a sensitivity assessment is not possible.
‘Insufficient evidence (IEv)’– is recorded where there is not enough evidence to assess the sensitivity of the specific feature/pressure combination, there is no suitable proxy information regarding the habitat (biotope) or species on which to base decisions, and expert judgement alone does not allow an assessment to be made with any confidence. An assessment of ‘Insufficient evidence’ means that, while there may be evidence of the effect of the pressure on the specific or similar features, it is incomplete, inconsistent, or otherwise not adequate to make an assessment with any confidence.
In addition, ‘Insufficient evidence’ is recorded when the evidence allows a species or habitat to be assessed as ‘Not sensitive’ to one or more sources (or pathways) of the pressure, the evidence does not allow an assessment of known additional sources (or pathways) of the pressure. Further evidence is required to make an inclusive assessment. For example, a habitat may be ‘Not sensitive’ to one or more known invasive species but it would be misleading to conclude that it was ‘not sensitive’ to one or more invasive species where the evidence is not conclusive. Note, that if the species or habitat is assessed as ‘sensitive’ to one or more pressure sources the ‘worst-case’ scenario is presented.
‘No evidence (NEv)’ – is recorded where there is no evidence on which to base an assessment of the sensitivity of the specific feature/pressure combination, there is no suitable proxy information regarding the habitat (biotope) or species on which to base decisions, and expert judgement alone does not allow an assessment to be made with any confidence. For example, some species have a limited distribution (e.g., a few or only one location) so even basic physical, chemical, or biological tolerances cannot be inferred.
Not relevant (NR) – is recorded where the evidence base suggests that there is no direct interaction between the pressure and the biotope group. ‘Not relevant’ is also used to denote interactions that are unlikely to occur at present or in future and to denote interactions that are literally ‘not relevant’, for example, deep mud habitats are not exposed to changes in emersion. In addition, ‘Not relevant’ is used to denote ‘default’ assessments that result from the definition of the pressure.
Not assessed (NA) – is recorded where the available evidence is extremely limited, poorly understood, or completely absent, and no assessment is attempted. For example, the likely effects of the pressure ‘Marine litter’ (pre-2014) on marine species were poorly understood and little studied so it was not possible to set a sensible ‘benchmark’. ‘Not assessed’ was also recorded for the ‘pollutant’ pressures because it was felt that the 2014 pressure benchmark (compliance with all relevant environmental standards) could be misleading. The contaminant pressure assessments are currently under review (Tyler-Walters et al., 2022).
6. Confidence assessment
Project MB0102 (Tillin et al. 2010) provided a single confidence score based on the robustness of the underlying evidence and was developed for assessments based on expert judgement. The approach developed by Tillin and Hull (2012-2013 Reports I-VII) was adapted for subsequent use for pressure-sensitivity assessments prepared by the project team for JNCC (Tillin and Tyler-Walters, 2014, d’Avack et al. 2014).
This approach assesses confidence in the evidence for three categories, the quality of the evidence or information used, the degree to which evidence is applicable to the assessment and the degree of agreement between evidence types (Table 6). The confidence assessment categories for resistance and resilience are combined to give an overall confidence score for the confidence category (i.e. quality of information sources, the applicability of evidence and the degree of concordance) for each individual feature/pressure assessment, using Table 7.
|
Confidence level |
Quality of evidence (information sources) |
Applicability of evidence |
Degree of concordance (agreement between studies) |
|---|---|---|---|
|
High |
Based on peer-reviewed papers (observational or experimental) or grey literature reports by established agencies (give number) on the feature (habitat, its component species, or species of interest). |
Assessment based on the same pressures acting on the same type of feature ( habitat, its component species, or species of interest) in the UK |
Agree on the direction and magnitude (of impact or recovery) |
|
Medium |
Based on some peer-reviewed papers but relies heavily on grey literature or expert judgement on the feature ( habitat, its component species, or species of interest) or similar features |
Assessment based on similar pressures on the feature (habitat, its component species, or species of interest) in other areas. |
Agree on direction but not magnitude (of impact or recovery) |
|
Low |
Based on expert judgement |
Assessment based on proxies for pressures e.g. natural disturbance events |
Do not agree on the direction or magnitude (of impact or recovery) |
|
|
Resistance confidence score |
||
|---|---|---|---|
|
Resilience confidence score |
Low |
Medium |
High |
|
Low |
Low |
Low |
Low |
|
Medium |
Low |
Medium |
Medium |
|
High |
Low |
Medium |
High |
7. Documented 'evidence base'
The evidence base and justification for the sensitivity assessments are recorded so that the basis of the sensitivity assessment is transparent and repeatable. A complete and accurate account of the evidence that was used to make the assessments is presented for each sensitivity assessment in the form of the literature review and a sensitivity matrix that records a summary of the assessment, the sensitivity scores and the confidence levels. The resultant review of 'evidence' is the ultimate source of information for the application of sensitivity assessments to management and planning decisions.
8. Quality assurance and peer review
The resultant sensitivity reviews are subject to quality assurance by the MarLIN Editor and, wherever possible, subject to peer review by one or more independent experts.
Limitations and assumptions
Sensitivity assessments must be applied carefully by trained marine biologists, for the following reasons.
- The sensitivity assessments are generic and NOT site-specific. They are based on the likely effects of a specified pressure on a ‘hypothetical’ population in the middle of its ‘environmental range’.
- Sensitivity assessments are NOT absolute values but are relative to the magnitude, extent, duration and frequency of the pressure affecting the species or community and habitat in question; thus the assessment scores are very dependent on the pressure benchmark levels used.
- Sensitivity assessments are generic assessments that indicate the likely effects of a given pressure (likely to arise from one or more activities) on species or habitats of conservation concern.
- The assessments are based on the magnitude and duration of pressures (where specified) but do not take account of spatial or temporal scale.
- The significance of impacts arising from pressures also needs to take into account the scale of the features.
- There are limitations of the scientific evidence on the biology of features and their responses to environmental pressures on which the sensitivity assessments have been based.
- The sensitivity assessment methodology takes account of both resistance and resilience (recovery). Recovery pre-supposes that the pressure has been alleviated but this will generally only be the case where management measures are implemented.
- Recovery is assumed to have occurred if a species population or habitat returns to a state that existed prior to the impact of a given pressure, not to some hypothetical pristine condition.
- Furthermore, sensitivity assessment assumes recovery to a ‘recognizable’ habitat or similar population of species, rather than presumes recovery of all species in the community or total recovery to prior biodiversity.
- As a general rule, where resistance is ‘Low’, the need for management measures should be considered, irrespective of the overall sensitivity assessment (for example where resilience is assumed to be high).
- A rank of ‘not sensitive’ does not mean that no impact is possible from a particular ‘pressure vs. feature’ combination, only that a limited impact was judged to be likely at the specified level of the benchmark.
- In line with the precautionary principle, a lack of scientific certainty should not, on its own, be a sufficient reason for not implementing management measures or other actions.
Differences between MarESA and MarLIN methods
The MarESA approach to sensitivity assessment is a development of the MarLIN approach based on new scales and benchmarks introduced by the MB0102 project and subsequent refinement of the approach (see Tyler-Walters & Hiscock, 2005; Tillin et al., 2010; Tillin & Hull, 2013; Tillin & Tyler-Walters, 2014). It represents an ongoing evolution of the sensitivity assessment process.
The approaches share the following.
- A defined process of literature review, documentation of evidence, and systematic assessment of the evidence to assess sensitivity (see Figure 1)
- The identification of elements of the feature for assessment, that is, the structuring, functioning and characteristic species
- The definition of benchmark levels of change in the pressures (or factors) likely to affect marine species and habitats
- The combination of an assessment of the likelihood of damage as a result of a specific pressure (resistance or intolerance) and the time taken for the species or habitat to recover (resilience or recoverability) to determine the sensitivity
- The estimation of confidence in the evidence
- Peer review wherever possible.
The approaches differ in the following.
- The list of pressures that likely affect marine species and habitats has been updated and expanded in line with statutory conservation agency advice and ongoing work to support marine planning and management advice in the UK, and the needs of the Marine Strategy Framework Directive (MSFD)
- As a result, the benchmarks for the expanded list of pressures have also been redefined.
- The resistance scale has changed slightly, with clear 'quantified' and 'qualified' terms.
- The resilience scale has changed to a four-point scale (rather than MarLIN's seven-point scale) based on Holling (1973).
- The combined sensitivity scale is changed to a four-point scale (rather than MarLIN's seven-point scale).
- The confidence assessment has been rewritten and expanded and now examines the 'quality', 'applicability', and 'concordance' of the evidence, based on a three-point scale.
Points 2, 4, and 5 above mean that the MarLIN and MarESA sensitivity assessment ranks are not directly comparable. However, the documented 'evidence base' remains the basis for all the assessments and their application in a management or decision-making context.
Bibliography
Note all MarLIN reports are available under publications.
- d’Avack, E.A.S., Tillin, H., Jackson, E.L. & Tyler-Walters, H., 2014. Assessing the sensitivity of seagrass bed biotopes to pressures associated with marine activities. Joint Nature Conservation Committee, JNCC Report No. 505, Peterborough, 83 pp. Available from https://www.marlin.ac.uk/publications
- Gibb, N., Tillin, H.M., Pearce, B. & Tyler-Walters, H., 2014. Assessing the sensitivity of Sabellaria spinulosa to pressures associated with marine activities. Joint Nature Conservation Committee. JNCC report No. 504, Peterborough, 67 pp. Available from https://www.marlin.ac.uk/publications
- Hiscock, K, Jackson, A. & Lear, D., 1999. Assessing seabed species and ecosystem sensitivities: existing approaches and development, October 1999 edition. Report to the Department of Environment, Transport and the Regions from the Marine Life Information Network (MarLIN). Marine Biological Association of the United Kingdom, Plymouth. [MarLIN Report No. 1.] Available from https://www.marlin.ac.uk/publications
- Holling C.S., 1973. Resilience and stability of ecological systems. Annual Review of Ecology and Systematics, 4(1), 1-23.
- Holt, T.J., Jones, D. R., Hawkins, S.J. & Hartnoll, R.G., 1997. The sensitivity of marine communities to man-induced change. Nature Conservation and the Irish Sea seminar. 6th February 1997, pp. 6-23. Irish Sea Forum, Liverpool, Seminar Report No. 15.
- Holt, T.J., Jones, D.R., Hawkins, S.J. & Hartnoll, R.G., 1995. The sensitivity of marine communities to man-induced change - a scoping report. Countryside Council for Wales, Bangor, CCW Contract Science Report, No. 65.
- Laffoley, D.A., Connor, D.W., Tasker, M.L. & Bines, T., 2000. Nationally important seascapes, habitats and species. A recommended approach to their identification, conservation and protection, pp. 17. Peterborough: English Nature.
- Mainwaring, K., Tillin, H. & Tyler-Walters, H., 2014. Assessing the sensitivity of blue mussel beds to pressures associated with human activities. Joint Nature Conservation Committee, JNCC Report No. 506., Peterborough, 96 pp. Available from https://www.marlin.ac.uk/publications
- McMath, A., Cooke, A., Jones, M., Emblow, C.S., Wyn, G., Roberts, S., Costello, M.J., Cook, B. & Sides, E.M., 2000. Sensitivity mapping of inshore marine biotopes in the southern Irish Sea (SensMap): Final report. Report by the Countryside Council for Wales (CCW), Ecological Consultancy Services Ltd (Ecoserve), Duchas, the Heritage Service, 116 pp. [Maritime Ireland /Wales INTERREG Reference no. 21014001].
- Oakwood Environmental Ltd, 2002. Development of a methodology for the assessment of cumulative effects of marine activities using Liverpool Bay as a case study. CCW Contract Science Report No 522.
- OSPAR, 2003. Annex V to the OSPAR Convention. Criteria for the Identification of Species and Habitats in need of Protection and their Method of Application (The Texel-Faial Criteria). OSPAR 03/17/1-E. 13 pp.
- OSPAR, 2008. OSPAR List of Threatened and/or Declining Species and Habitats (Reference Number: 2008-6). OSPAR Convention For The Protection Of The Marine Environment Of The North-East Atlantic. Available from: http://www.jncc.gov.uk/pdf/08-06e_OSPAR List species and habitats.pdf
- Roberts, C., Smith, C., H., T. & Tyler-Walters, H., 2010. Review of existing approaches to evaluate marine habitat vulnerability to commercial fishing activities. Report to the Environment Agency from the Marine Life Information Network and ABP Marine Environmental Research Ltd. Environment Agency Evidence Report: SC080016/R3. Environment Agency, Peterborough. Available from https://www.marlin.ac.uk/publications
- Robinson, L.A., Rogers S. & Frid, C.L.J. 2008. A marine assessment and monitoring framework for application by UKMMAS and OSPAR - Assessment of Pressures and Impacts. Phase II: Application for regional assessments. JNCC Contract No: C-08-0007-0027. UKMMAS, 2010. Charting Progress 2.
- Tillin, H. & Tyler-Walters, H., 2014. Assessing the sensitivity of subtidal sedimentary habitats to pressures associated with marine activities. Phase 2 Report – Literature review and sensitivity assessments for ecological groups for circalittoral and offshore Level 5 biotopes. JNCC Report No. 512B, 260 pp. Available from https://www.marlin.ac.uk/publications
- Tillin, H.M., Hull, S.C. & Tyler-Walters, H., 2010. Development of a sensitivity matrix (pressures-MCZ/MPA features). Report to the Department of the Environment, Food and Rural Affairs from ABPmer, Southampton and the Marine Life Information Network (MarLIN) Plymouth: Marine Biological Association of the UK., Defra Contract no. MB0102 Task 3A, Report no. 22., London, 145 pp. Available from: http://randd.defra.gov.uk/Default.aspx?Menu=Menu&Module=More&Location=None&Completed=0&ProjectID=16368
- Tyler-Walters, H. & Hiscock, K., 2005. Impact of human activities on benthic biotopes and species. Report to Department for Environment, Food and Rural Affairs from the Marine Life Information Network (MarLIN), contract no. CDEP 84/5/244. Marine Biological Association of the UK, Plymouth. [View final report]
- Tyler-Walters, H., Hiscock, K., Lear, D.B. & Jackson, A., 2001. Identifying species and ecosystem sensitivities. Report to the Department for Environment, Food and Rural Affairs from the Marine Life Information Network (MarLIN), Marine Biological Association of the United Kingdom, Plymouth. Contract CW0826. Available from https://www.marlin.ac.uk/publications
- Tyler-Walters, H. & Jackson, A. 1999. Assessing seabed species and ecosystems sensitivities. Rationale and user guide, January 2000 edition. Report to English Nature, Scottish Natural Heritage and the Department of the Environment Transport and the Regions from the Marine Life Information Network (MarLIN). Plymouth, Marine Biological Association of the UK. (MarLIN Report No. 4.). Available from https://www.marlin.ac.uk/publications
