Information on the biology of species and the ecology of habitats found around the coasts and seas of the British Isles
Navigation
Report export guidelines
Understanding the report outputs
Multiple classification systems are present in the uASM. Therefore, there will be some linkage outputs that do not have direct correlations to other habitat classifications. These are designated with a dash (-) in the report results. The exported outputs state the habitat classification used in the original data. The default habitat classification is EUNIS 2007 unless you chose to search with the JNCC 97.06 filter. The default Ecosystem Service classification is CICES. All corresponding classification systems will be viewable in the exported CSV (comma separated values) file.
Understanding the columns in the report (CSV)
The CSV column names are defined in Table 1.
Table 1. CSV column names.
Column name
Column content
ID
Unique Identifier within uASM database
EUNIS_2007
EUNIS 2007 habitat classification system
JNCC_9706
JNCC 9706 habitat classification system
JNCC_2022
JNCC 2022 habitat classification system
species
Scientific and common name of the species
CICES
Common International Classification of Ecosystem Services V5.1
ESSupplyLevelSource
This is the original ecosystem supply level score direct from the source reference
Ecosystem_Service_Type_Source
This is the original ecosystem service classification system used from the source reference e.g. IPBES, Direct from Reference etc
Ecosystem_Service_Source
This is the original ecosystem service as described in the source reference e.g. Waste remediation, 1.1.6.x etc.
supplyLevel
Ecosystem Service Supply score (High (3), Medium (2), Low (1), Negligible (0) and NA (0))
confidence
Confidence score of linkage data (High (3), Medium (2), Low (1))
confidenceType
Original linkage source e.g., literature review, personal communication etc.
referenceShort
Citation of Linkage
referenceFull
Full reference of Linkage
How to create an ASM from your exported report
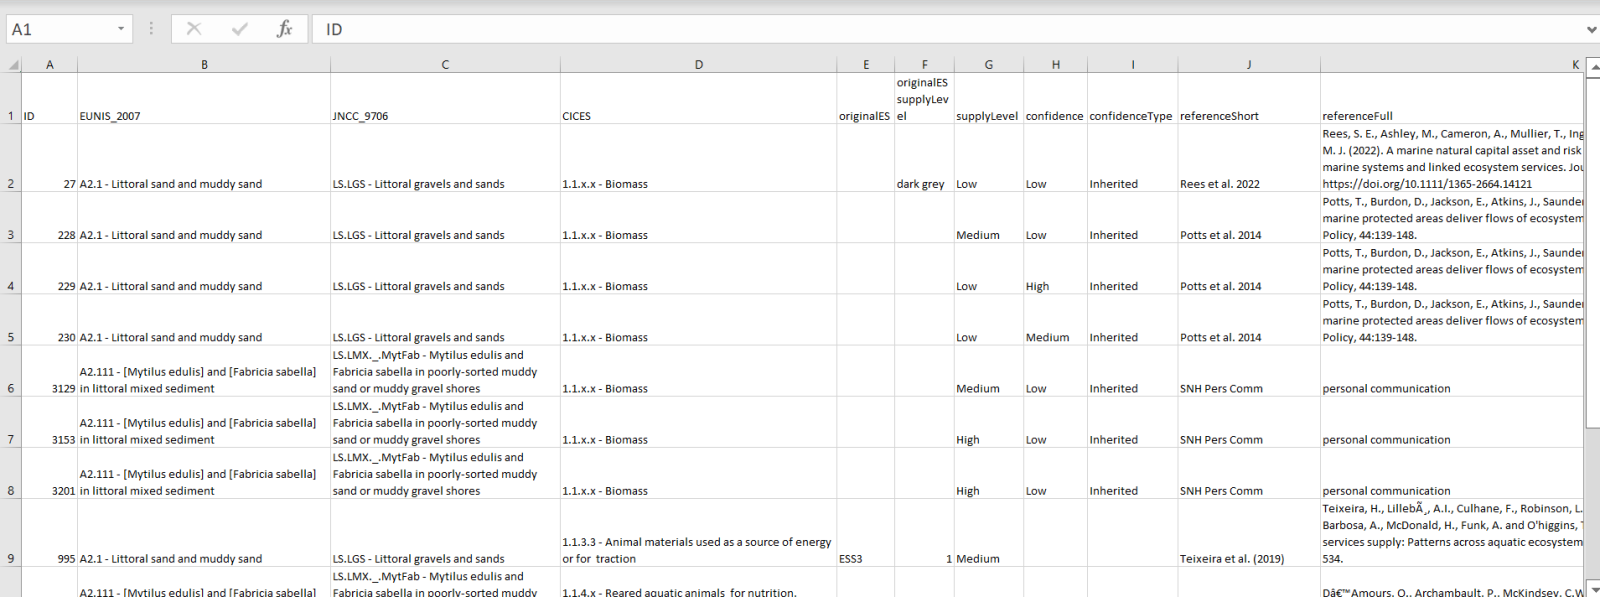
Download your required data from the uASM tool by using the ‘Export report’ button in the search uASM webpage. The raw CSV file includes the columns listed in Table 1 (above) and shown in Figure 1.
Figure 1. Image of downloaded raw CSV file
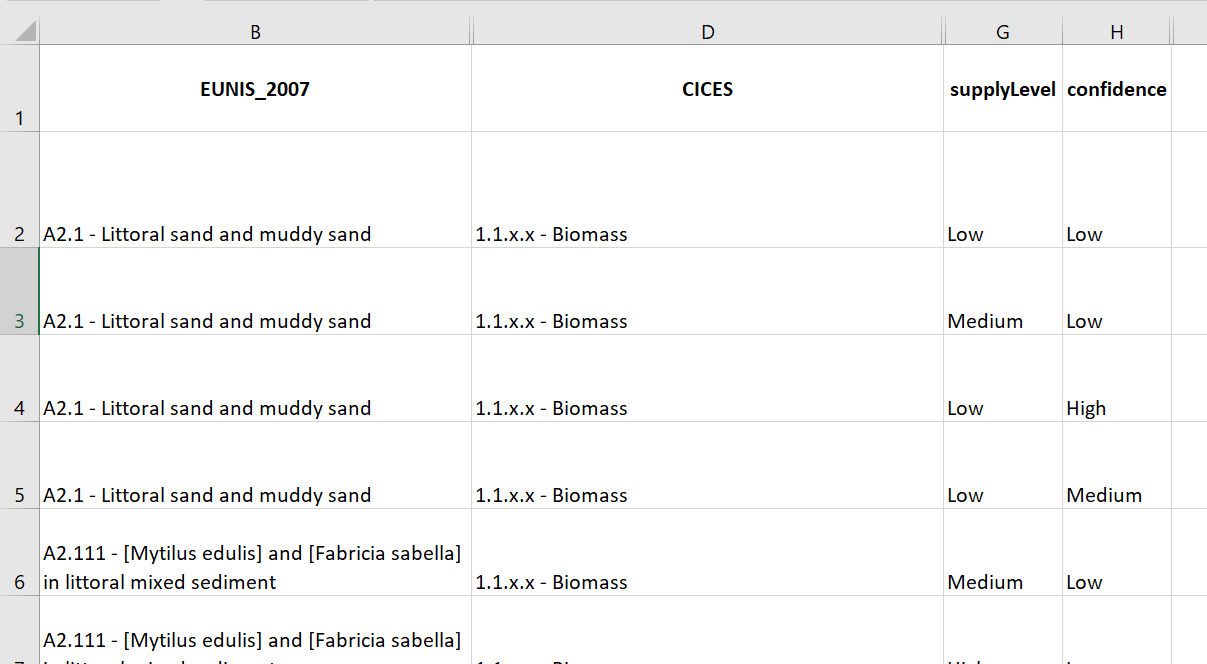
Hide any columns that are not required (in Excel) by right-clicking the top of the column and selecting 'hide'. To generate a bespoke ASM we recommend keeping your Asset (species or habitat), CICES, Supply Level, Confidence, and referenceFull columns viewable.
Figure 2. Example Excel worksheet with EUNIS_2007, CICES, Supply Level and Confidence fields shown.
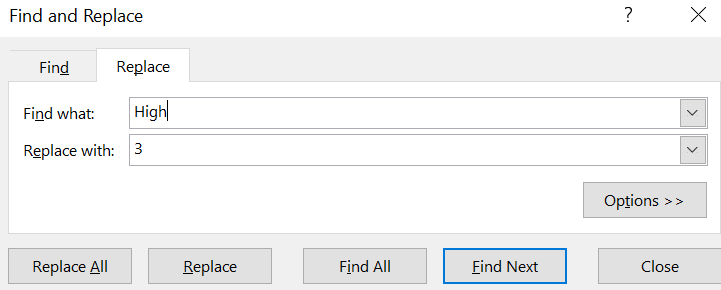
Generate a Bespoke ASM. Both the supplylevel and Confidence columns need to be converted into a numerical format as so: High (3), Medium (2), Low (1), negligible (0), Data Deficient (Blank Cell). This is achieved by:
Left-clicking both columns, moving to the ‘Home’ tab, scroll right to the editing section;
Left-click the ‘Find & Select’ button and select ‘Replace’; and
Select the ‘Replace’ tab and enter your supply level text (High) into the ‘Find what:’ section and add its corresponding number (3) in the ‘Replace with’ section (Figure 3).
Make sure the supplyLevel and Confidence columns are highlighted before running the tool and click ‘Replace All’.
Figure 3. Example of how to use the find and replace dialogue box.
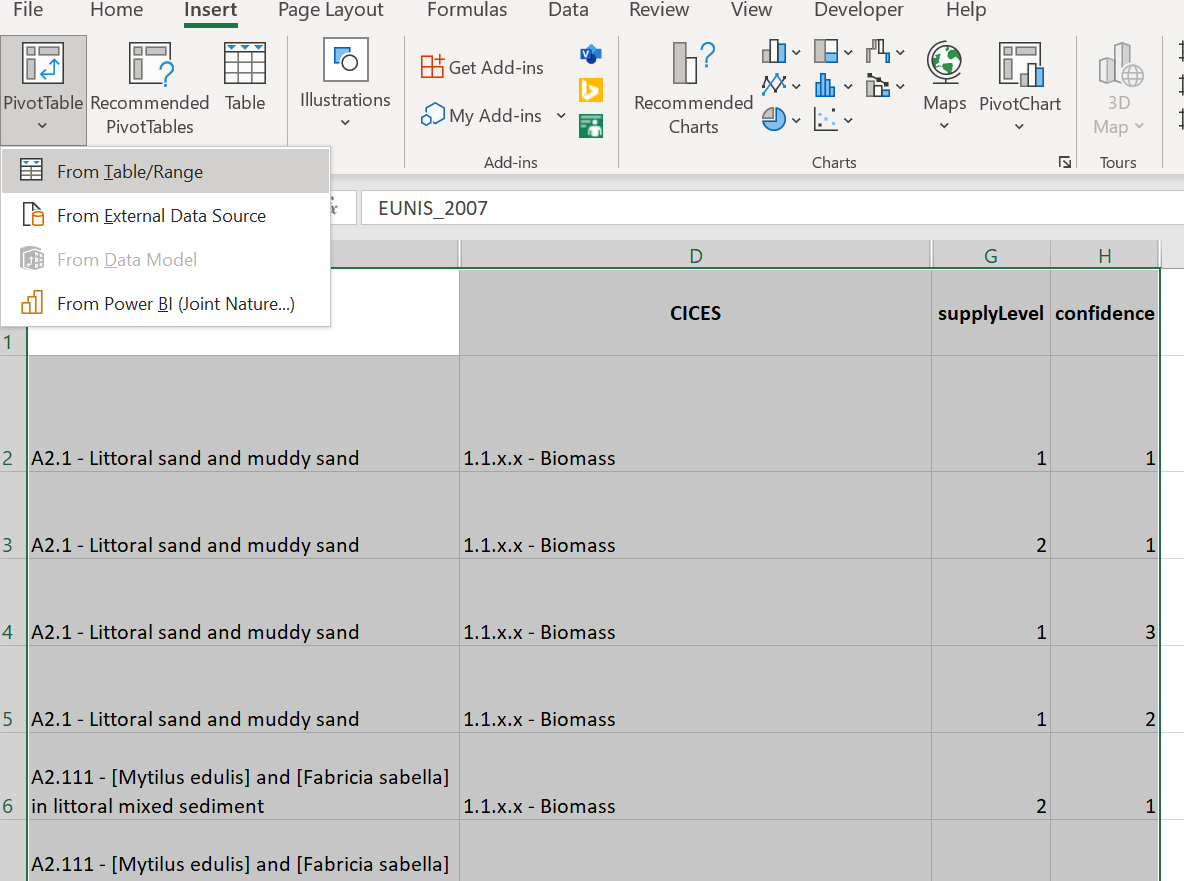
Create a Pivot Table from your data. Select all data in the Excel worksheet. Left-click the ‘Insert tab’, click ‘Pivot Table’, select ‘From Table/Range’ and click ‘OK’. A new worksheet will be created to construct your Pivot Table.
Figure 4. Image of PivotTable button in ‘Insert’ dialog box.
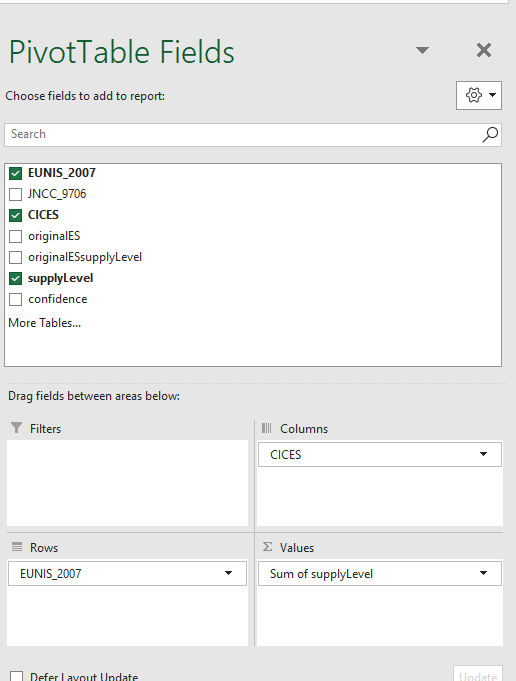
Constructing your ASM. Construct your bespoke ASM with the ‘PivotTable Fields’ section drag and drop CICES into the Columns, your Assets (habitat code or species) into Rows, and supplyLevel into Values.
Figure 5. The PivotTable fields tab showing EUNIS_2007 in the Rows section, CICES in the Columns section and Sum of supplyLevel in Values Section.
Calculate the average 'SupplyLevel'.
Left-click ‘Count of supplyLevel’ in the Values section;
Select ‘Average’ before left-clicking ‘Number Format’;
Select ‘Number’ and change ‘Decimal Places’ to '0';
and click ‘OK’, and ‘OK’ again (Figure 6).
Figure 6. How to calculate the average 'supplyLevel' value.
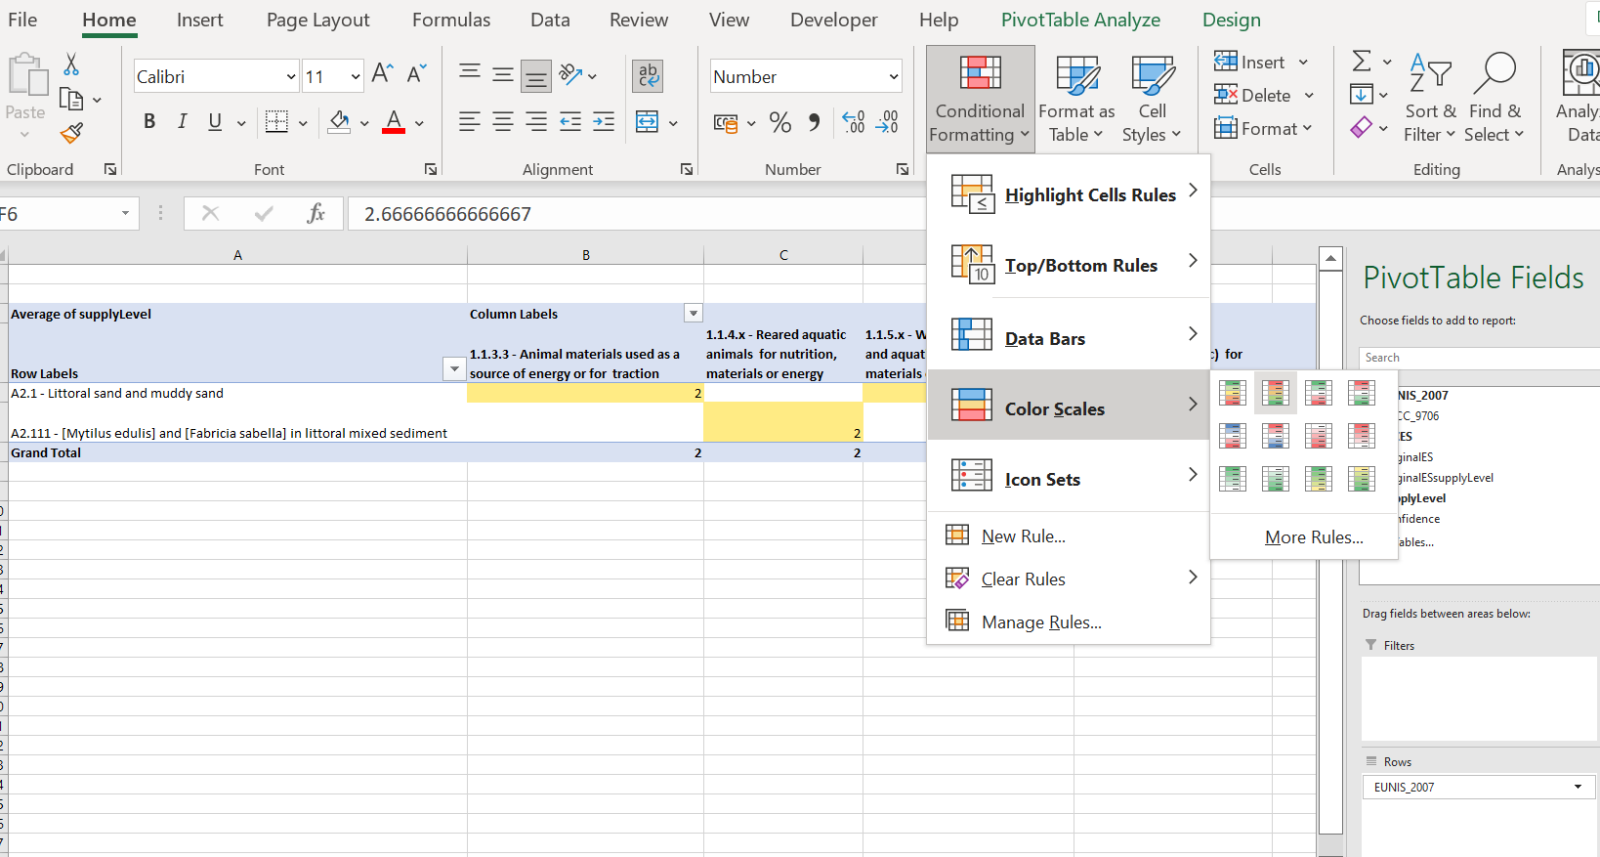
Highlighting scores in your ASM. To highlight your Supply level scores:
Go to the 'Home' menu and select 'conditional formatting'.
Then select 'colour scales', and
Select how you want to show your ASM scores.
We recommend using 3 (red), 2 (yellow), and 1 (green) but this is a personal preference (Figure 7). Any intermediate colours indicate the score was generated from multiple linkages with different scores (to understand this further read step 8).
Figure 7. Example of how to use conditional formatting to highlight scores.
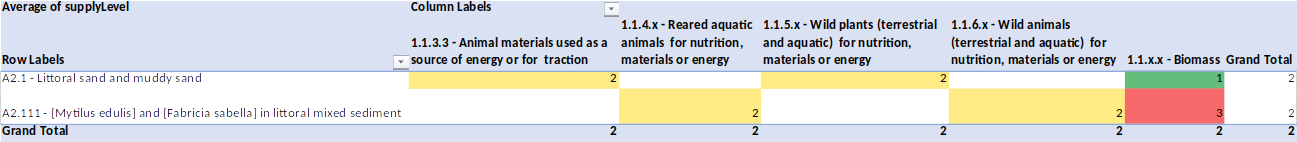
Example complete Bespoke ASM. Save the ASM as an Excel workbook (.xlsx) for the most functionality, for example, when double-clicking a supply level score it will open a new tab with all linkages that were used to generate the score (Figure 8). To save the file, select ‘File’ then ‘Save As’, ‘Browse’ and select ‘Save as type: Excel workbook (*.xlsx)’.
Figure 8. Example bespoke ASM worksheet.