uASM Spatial Mapping Tool
The uASM (universal Asset Services Matrix) spatial mapping tool has been co-designed by the JNCC (Joint Nature Conservation Committee) and MarLIN at the MBA (Marine Biological Association) to help users visualise potential ecosystem services provided by subtidal marine habitats across the United Kingdom. It uses the universal Asset Service Matrix (uASM) data hosted by MarLIN and spatial habitat data from the UKSeaMap.
Uses and limitations
The mapping tool visualises the potential ecosystem services provided by subtidal marine habitats. The spatial data does not currently include intertidal habitats or species data. It is not a GIS tool and does not provide spatial analyses. If users want to carry out spatial analyses, they can download the UKSeaMap habitat data and uASM data separately. To understand the underlying data in the uASM, please visit the uASM homepage.
The tool uses the EUNIS 2007 habitat classification for habitat data, and the CICES v5.2 classification to represent ecosystem services (ES). The uASM links marine habitats with the ES they are reported or predicted to provide. However, the mapped ES are listed as 'potential' because not all possible ES linked to any particular habitat may be realised in every specific location of that habitat.
The spatial habitat data is provided by UKSeaMap. The tool is limited currently to the first 30,000 results to ensure the efficient running of the tool due to the size of the spatial dataset. A warning will appear if more than 30,000 results are available. Therefore, we recommend keeping your search criteria as precise as possible. Examples can be found in the ‘How to use’ guide below.
The spatial mapping tool allows users to select specific 'habitat assets' using the EUNIS 2007 codes and habitat names. If you select 'Include hierarchy sub-levels' the generated bespoke uASM below the spatial element, will show all available ES data for every EUNIS level selected and included in the uASM.
The resolution of the habitat data in UKSeaMap is limited to EUNIS levels one to four. Therefore, the resolution of ES data shown in the generated results is restricted to CICES Level 2 so they have a comparable level of detail. Any ES linkages that fell under CICES level 3 or 4 are aggregated into the CICES level 2 score. The ‘#Unique links’ column highlights the number of unique linkages within the uASM used to generate the results. This number is generated from linkages at levels 3 and 4 to generate an accumulated score. If you want to interrogate data below CICES level 2 you can view and download this from the uASM.
UKSeaMap habitat data
The habitat data used in the mapping tool is provided by the UKSeaMap. A detailed description of the UKSeaMap together with a download of the data can be found here:
Marine habitat data product: UKSeaMap | JNCC - Adviser to Government on Nature Conservation
The UKSeaMap uses a predictive habitat model. All habitats are represented at either EUNIS level three or four, which provides a better UK-wide coverage than more detailed combined maps. Users should also be aware that the UKSeaMap only includes below subtidal habitats. No intertidal habitat information is available.
If you are interested in further detail for a specific location, the EUNIS level 3 combined map allows you to integrate data at lower EUNIS levels and combine it with uASM outputs.
Exporting your selected data
Once you are happy with your selected data you can export your bespoke ASM as a *.csv (comma-separated values) file using the ‘Export’ button. The bespoke ASM export from the uASM spatial tool is a simplified version of the bespoke ASM generated by the main uASM tool. This was done to improve data usability for a wider audience, whilst containing key information to quickly combine with EUNIS 2007 based spatial data in GIS.
If you require a more detailed output with multiple habitat codes MHCBI v22.04 (JNCC, 2022) and v97.06 (JNCC, 1997), CICES v5.1 or more detailed information from the source literature e.g. original ecosystem service and supply score please re-input your spatial map search into the original uASM.
How to use the uASM Spatial Mapping Tool
The mapping tool can search and visualise Ecosystem Services (ES) in three ways:
- General search by habitat asset using the query form provided,
- Bounding box search via the map, or
- A combination of the two.
General search using the query form
A general search approach works best if you are looking at the whole of the UK and a few specific target habitats.
- Select habitat types to search for using the ‘Habitat Assets’ filter (Figure 1). Either:
- scroll and select a EUNIS habitat code, or
- manually search by typing the code or habitat name into the search box.
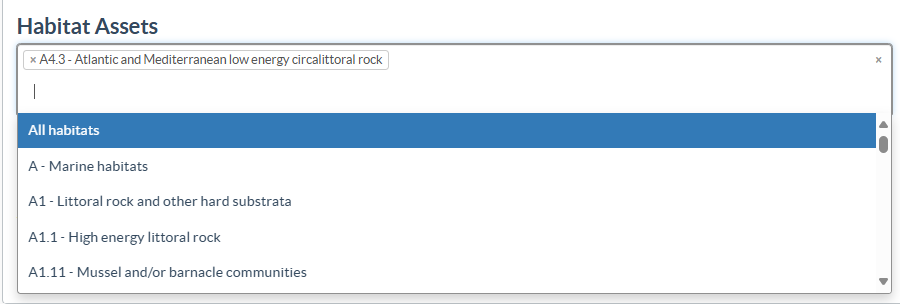
Figure 1: Habitat assets box and pull-down list of habitats
- Refine the search using the ‘Ecosystem Services’ filter section (Figure 2). Specific confidence data or service supply levels can be selected using the buttons provided. The confidence or service supply levels can be toggled ‘on’ or ‘off’ by clicking on the buttons. Leaving this section blank to search the whole uASM.
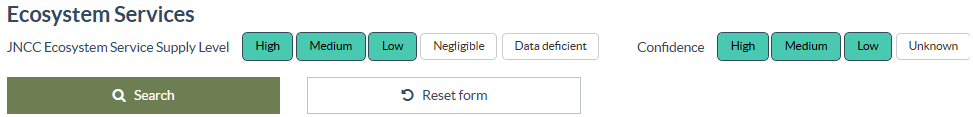
Figure 2: Ecosystem service filter section - When you are happy with the search criteria click ‘Search’ and it will generate the spatial map and bespoke ASM (Figure 3).
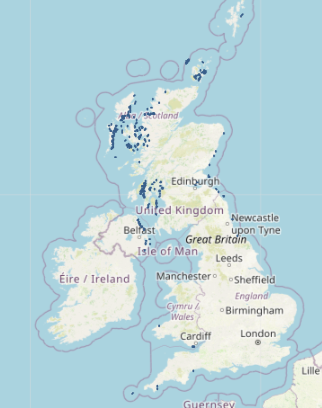
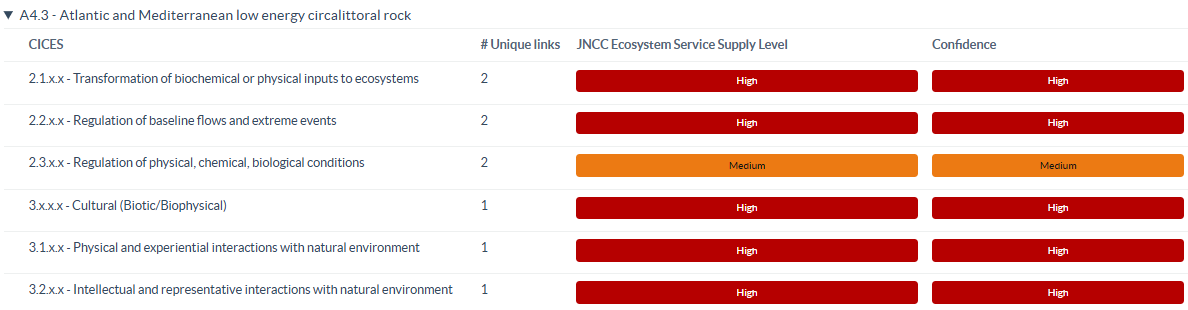
Figure 3: Example spatial map and summary asset service matrix based on a search for EUNIS habitat A4.3 Atlantic and Mediterranean low energy circalittoral rock - Select the ‘Include hierarchy’ button on the query form to generate ecosystem service scores for any habitats which fall within the selected EUNIS code (Figure 4).
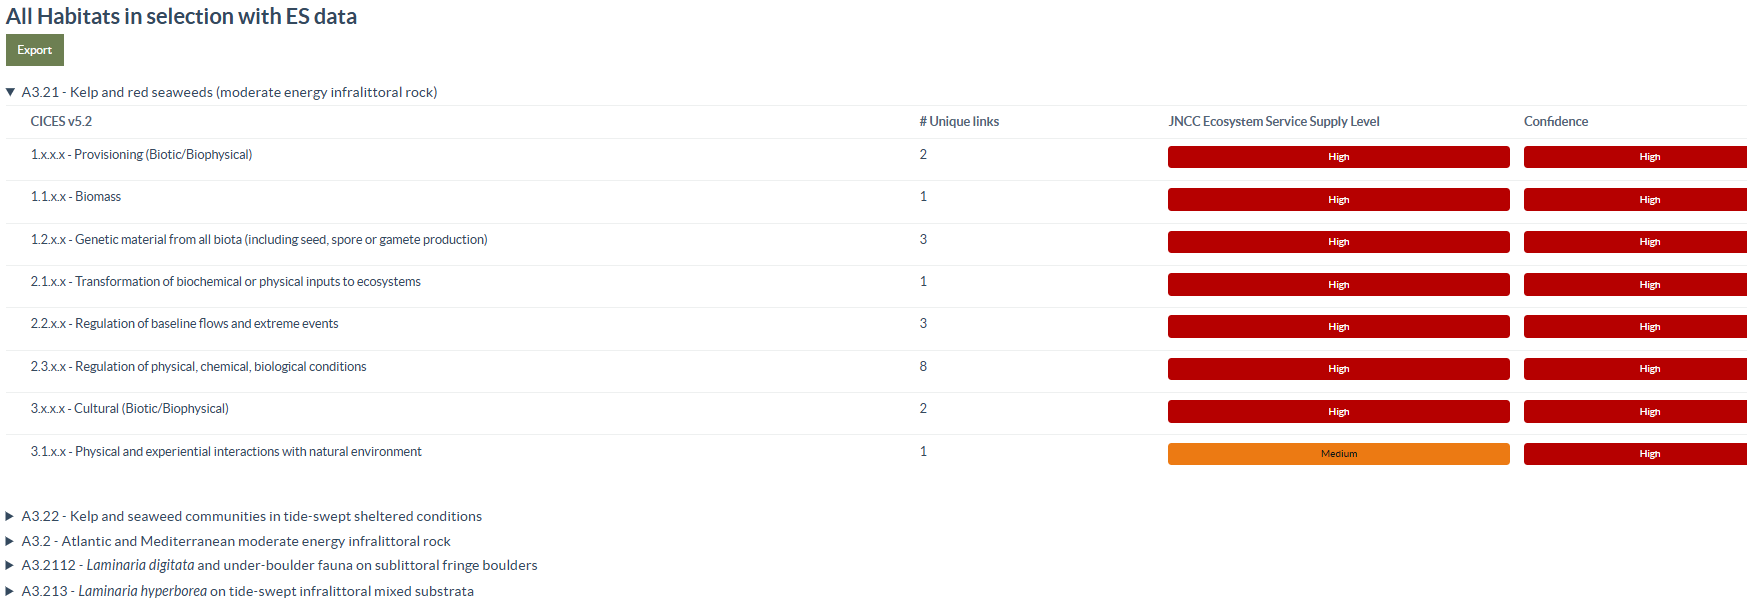
Figure 4: Example summary asset service matrix based on a search for EUNIS habitat A3.2 Atlantic and Mediterranean moderate energy infralittoral rock - Once you are happy with your search terms you can export your selected data in the form of a simplified bespoke ASM (For full detailed ASM please use the main uASM)
Searching the map using the Bounding Box
The bounding box is best when you need to search for a specific area or region or are have issues generating results at a whole UK scale.
- The tools to create the bounding box are located on the top left side of the mapping tool.
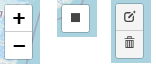
- To draw your bounding box, click the square icon
 and then click and drag your box on the tool (Figure 5). Zoom into or out of the map using the +/- buttons or your mouse to choose your area of interest.
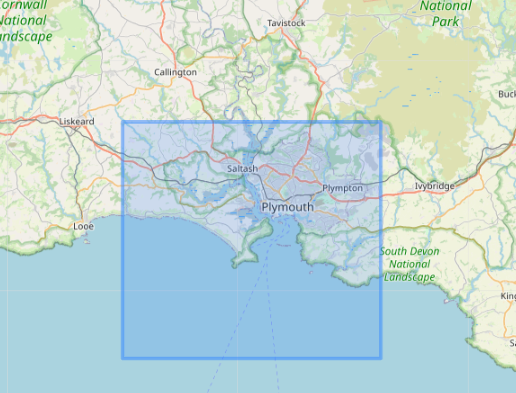
Figure 5: Example of a bounding box around Plymouth Sound - If you are not happy with the box drawn you can reshape or delete it using the tools.
 Drag the corners of the box to resize and reshape or click on the centre to reposition (Figure 6).
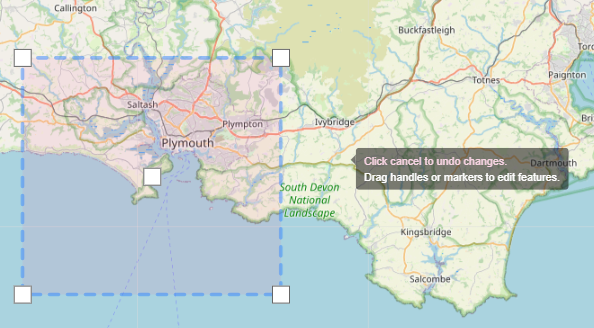
Figure 6: Example bounding box with resizing boxes - Once you are happy with the bounding box, click ‘search’ to map relevant habitats and generate a bespoke summary ASM. Be aware that the results will include any habitat polygons that only slightly fall into your box so some results will extend past the drawn box range (Figure 7).
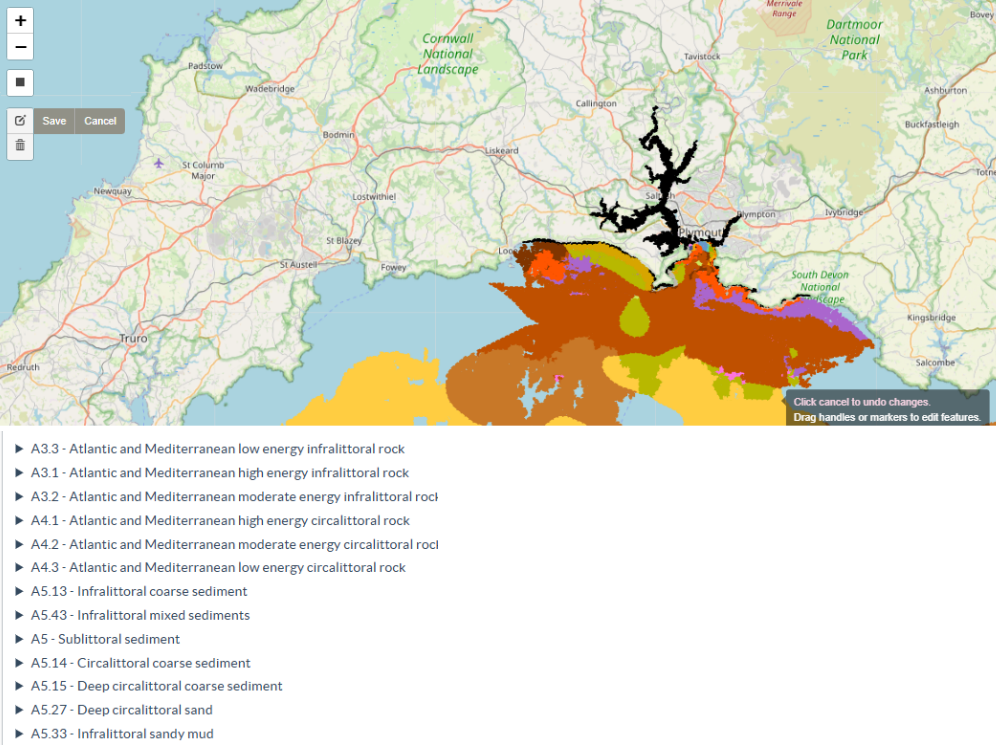
Figure 7: Example map showing the habitat polygons returned using the bounding box in Figure 5 and the resultant summary ASM - Once you are happy with your search terms you can export your selected data in the form of a simplified bespoke ASM (for a full detailed ASM please use the main uASM search).
Troubleshooting
The tool is limited currently to the first 50,000 results to ensure the efficient running of the tool due to the size of the spatial dataset. Therefore, if broad search terms are used you may only get partial results or be timed out.
If this occurs, we recommend refreshing the page (using the button provided) and reducing your search terms by either using a bounding box to reduce the area searched or selecting key priority habitats you are interested in.
Last updated 2025-02-04
