Barren littoral shingle
Barren littoral shingle
Photographer: David Connor Copyright: Joint Nature Conservation Committee (JNCC)

Barren littoral shingle
Photographer: Dr Keith Hiscock Copyright: Joint Nature Conservation Committee (JNCC)
Barren littoral shingle
Photographer: Dr Keith Hiscock Copyright: Joint Nature Conservation Committee (JNCC)

| Researched by | Dr Heidi Tillin & Georgina Budd & Dr Harvey Tyler-Walters | Refereed by | Admin |
|---|
Summary
UK and Ireland classification
Description
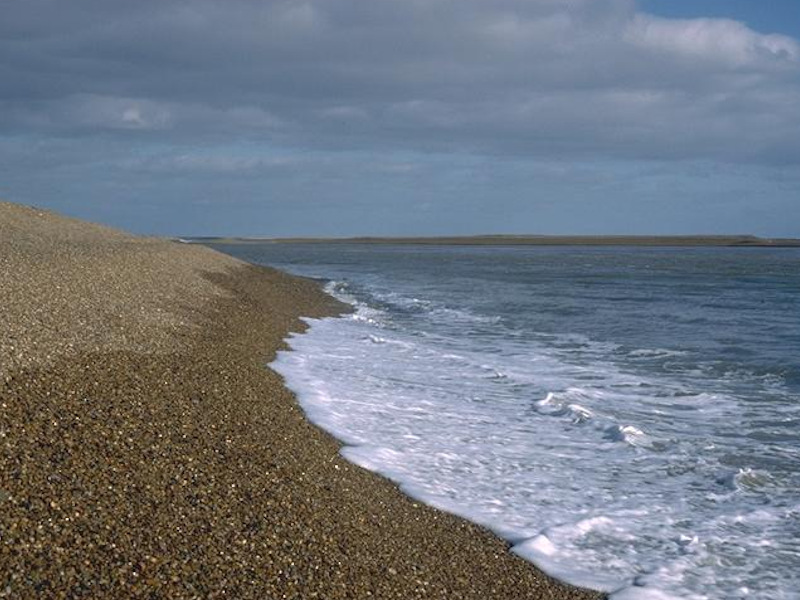
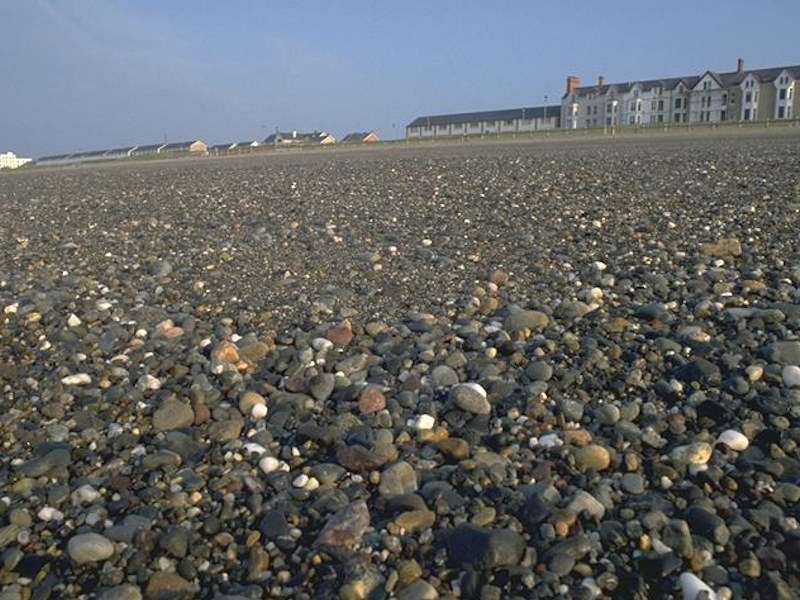
Shingle or gravel shores, typically with sediment particle size ranging from 4 - 256 mm, sometimes with some coarse sand mixed in. This biotope is normally only found on exposed open coasts in fully marine conditions. Such shores tend to support virtually no macrofauna in their very mobile and freely draining substratum. The few individuals that may be found are those washed into the habitat by the ebbing tide, including the occasional amphipod or small polychaete. LS.LCS.Sh.BarSh often extends over the whole shore, sometimes extending into the subtidal zone. BarSh may occur on the upper shore above BarSa, and in moderately exposed conditions, above AmSco on the lower shore. Tal may occur on the same shore as BarSh, where drift lines of algae and other debris accumulate on the upper shore. There may be a temporary cover of the green seaweeds Ulva spp. during periods of stability in the summer. (Information from Connor et al., 2004; JNCC, 2015).
Depth range
Upper shore, Mid shore, Lower shoreAdditional information
-
Listed By
Sensitivity review
Sensitivity characteristics of the habitat and relevant characteristic species
Shingle shores tend to support virtually no macrofauna in their very mobile and freely draining substratum. The few individuals that may be found are those washed into the habitat by the ebbing tide, including the occasional amphipod or small polychaete. The sensitivity assessments are, therefore, based on the abiotic (non-living) habitat.
Resilience and recovery rates of habitat
This biotope is subject to high levels of abrasion resulting from sediment mobility. The species that are present (if any) are robust animals that can withstand some physical disturbance and/or recover rapidly, or migrate as adults into the biotope. The LS.LCS.Sh.BarSh biotope is primarily identified by the type of the substratum, dominated by shingle or gravel with sediment particle size ranging from 4 -256 mm (JNCC, 2015), which also include cobbles and pebbles. It is found from the upper to lower shore, depending on wave exposure. The biological community, which may be absent, or if present, occur in extremely low abundance. Therefore, the substratum type (shingle, gravel, cobbles and pebbles) is used primarily to indicate the sensitivity of this biotope and no species indicative of sensitivity are chosen.
Resilience assessment. As this biotope is characterized by the absence, rather than the presence of species, recovery is assessed as 'High' for any level of impact. An exception is made for permanent or ongoing (long-term) pressures where recovery is not possible as the pressure is irreversible, in which case resilience is assessed as ‘Very low’ by default. The biotope would be considered to be sensitive to pressures that allowed the establishment of a permanent, species rich biological assemblage as low abundances and low species richness are characteristic of the biotope.
Climate Change Pressures
Use [show more] / [show less] to open/close text displayed
| Resistance | Resilience | Sensitivity | |
Global warming (extreme) [Show more]Global warming (extreme)Extreme emission scenario (by the end of this century 2081-2100) benchmark of:
EvidenceThis biotope is characterized by the absence of species resulting from sediment mobility and abrasion (JNCC, 2015), rather than the presence of typical species. Therefore, changes in temperature will not alter the biotope as it is defined by the abiotic habitat. Hence, resistance to an increase in temperature is assessed as 'High' and resilience as ‘High’ (by default) and this biotope is assessed as 'Not sensitive'. | HighHelp | HighHelp | Not sensitiveHelp |
Global warming (high) [Show more]Global warming (high)High emission scenario (by the end of this century 2081-2100) benchmark of:
EvidenceThis biotope is characterized by the absence of species resulting from sediment mobility and abrasion (JNCC, 2015), rather than the presence of typical species. Therefore, changes in temperature will not alter the biotope as it is defined by the abiotic habitat. Hence, resistance to an increase in temperature is assessed as 'High' and resilience as ‘High’ (by default) and this biotope is assessed as 'Not sensitive'. | HighHelp | HighHelp | Not sensitiveHelp |
Global warming (middle) [Show more]Global warming (middle)Middle emission scenario (by the end of this century 2081-2100) benchmark of:
EvidenceThis biotope is characterized by the absence of species resulting from sediment mobility and abrasion (JNCC, 2015), rather than the presence of typical species. Therefore, changes in temperature will not alter the biotope as it is defined by the abiotic habitat. Hence, resistance to an increase in temperature is assessed as 'High' and resilience as ‘High’ (by default) and this biotope is assessed as 'Not sensitive'. | HighHelp | HighHelp | Not sensitiveHelp |
Marine heatwaves (high) [Show more]Marine heatwaves (high)High emission scenario benchmark: A marine heatwave occurring every two years, with a mean duration of 120 days, and a maximum intensity of 3.5°C. Further detail. EvidenceThis biotope is characterized by the absence of species resulting from sediment mobility and abrasion (JNCC, 2015), rather than the presence of typical species. Therefore, changes in temperature will not alter the biotope as it is defined by the abiotic habitat. Hence, resistance to periodic extremes of temperature due to heatwaves is assessed as 'High' and resilience as ‘High’ (by default) and this biotope is assessed as 'Not sensitive'. | HighHelp | HighHelp | Not sensitiveHelp |
Marine heatwaves (middle) [Show more]Marine heatwaves (middle)Middle emission scenario benchmark: A marine heatwave occurring every three years, with a mean duration of 80 days, with a maximum intensity of 2°C. Further detail. EvidenceThis biotope is characterized by the absence of species resulting from sediment mobility and abrasion (JNCC, 2015), rather than the presence of typical species. Therefore, changes in temperature will not alter the biotope as it is defined by the abiotic habitat. Hence, resistance to periodic extremes of temperature due to heatwaves is assessed as 'High' and resilience as ‘High’ (by default) and this biotope is assessed as 'Not sensitive'. | HighHelp | HighHelp | Not sensitiveHelp |
Ocean acidification (high) [Show more]Ocean acidification (high)High emission scenario benchmark: a further decrease in pH of 0.35 (annual mean) and corresponding 120% increase in H+ ions , seasonal aragonite saturation of 20% of UK coastal waters and North Sea bottom waters, and the aragonite saturation horizon in the NE Atlantic, off the continental shelf, occurring at a depth of 400 m by the end of this century 2081-2100. Further detail EvidenceThis biotope is characterized by the absence of species resulting from sediment mobility and abrasion (JNCC, 2015), rather than the presence of typical species. Therefore, changes in acidification and carbonate chemistry as a result of increased pC02 will not alter the biotope as it is defined by the abiotic habitat. Hence, resistance to an increase in pC02 is assessed as 'High' and resilience as ‘High’ (by default) and this biotope is assessed as 'Not sensitive'. | HighHelp | HighHelp | Not sensitiveHelp |
Ocean acidification (middle) [Show more]Ocean acidification (middle)Middle emission scenario benchmark: a further decrease in pH of 0.15 (annual mean) and corresponding 35% increase in H+ ions with no coastal aragonite undersaturation and the aragonite saturation horizon in the NE Atlantic, off the continental shelf, at a depth of 800 m by the end of this century 2081-2100. Further detail. EvidenceThis biotope is characterized by the absence of species resulting from sediment mobility and abrasion (JNCC, 2015), rather than the presence of typical species. Therefore, changes in acidification and carbonate chemistry as a result of increased pC02 will not alter the biotope as it is defined by the abiotic habitat. Hence, resistance to an increase in pC02 is assessed as 'High' and resilience as ‘High’ (by default) and this biotope is assessed as 'Not sensitive'. | HighHelp | HighHelp | Not sensitiveHelp |
Sea level rise (extreme) [Show more]Sea level rise (extreme)Extreme scenario benchmark: a 107 cm rise in average UK by the end of this century (2018-2100). Further detail. EvidenceA rise in sea level increases the water depth at the shore and results in increased wave and tidal energy along the shore, due to the increase in fetch and reduction in wave attenuation (Pethick, 2001; Crooks, 2004; Fujii, 2012). As a result, coastal landforms (e.g. subtidal bedforms, intertidal flats, saltmarshes, shingle banks, sand dunes, cliffs and coastal lowlands) migrate along and parallel to the shore to maintain their position with the coastal energy gradient (Cooks, 2004; Fujii, 2012). For example, mudflats migrate landwards to a lower energy position and may be replaced by sand flats that have themselves migrated landwards from exposed conditions (Crooks, 2004). In effect, ‘coastal roll-over’ results as the shore moves landwards by the erosion of the landward, upper limit of the shore and deposition at its lower limit (Crooks, 2004). Pethick (2001) suggested that a sea-level rise rate of 6 mm/yr could result in landward movement of estuaries by 10 m/yr, long-shore migration of open coast landforms of 50 m/yr and ebb-tidal deltas to extend laterally by 300 m/yr. For example in Norfolk, the coarse sediment beaches of Scolt Head Wells were predicted to be replaced by mudflats and saltmarsh, while sand beaches were predicted to replace salt marsh and sand dune area of Thornham, Scolt and Stiffkey (Pethick, 2001). However, many shores will not be able to move landward, either due to natural barriers (e.g. rock or cliff) or artificial structures (e.g. roadways, sea defences), resulting in ‘coastal squeeze’ and the potential substantial loss of intertidal habitat (Fujii, 2012; Mossman et al., 2015). Increased water depth and increased wave action may change to the shore from a dissipative to reflective morphology with a steeper slope and coarser sediment but lower biomass (Fujii, 2012). For example, 61% of 1084 shore profiles in England and Wales had already experienced steepening since the mid-19th century due to foreshore erosion and flood defences (Taylor et al., 2014; Fujii, 2012). Fujii & Raffaelli (2008) modelled the likely effects of sea-level rise on the Humber estuary. They suggested that sea–level rises of 10 cm, 30 cm, and 50 cm would result in loss of 2.2%, 6.7% and 11.2% of the intertidal area (including mud and sand flats), and when beach steepening and sediment shifts were taken into account, loss in macrobenthos of 6.7, 11.6 and 11.9% respectively. They concluded that a 30 cm increase in sea-level could result in an overall loss in the macrobenthos of 22.8% (Fujii & Raffaelli, 2008). Galbraith et al. (2002) modelled the effect of sea-level rise at five wetland sites in the USA on tidal flats (mud and sand). They suggested that sea-level rise produced by a 2°C change (predicted as 34-77 cm by 2100) in the USA, could result in a 20-70% loss of current intertidal area at four of the sites examined, although there was variation between sites (Galbraith et al., 2002). The effects of sea-level rise and increased wave action may be increased further due to storms and storms surges. IPCC (2019) note that the frequency of extreme sea-level events (e.g. due to storm) was predicted to increase as sea-level rises. However, there is no consensus on the future storm and wave climate around UK coasts (Mossman et al., 2015; Lowe et al., 2018; Palmer et al., 2018). Sensitivity assessment. This is a physical habitat dominated by shingle, gravel, cobbles and pebbles (JNCC, 2015). It is found from the upper to lower shore, depending on wave exposure and subject to a high level of abrasion due to sediment mobility. The evidence suggests that sea-level rise could result in landward migration of the habitat as the upper reaches of the shore are eroded and the lower reaches submerged. However, where hard structures (e.g. cliffs, sea defences) prevent landward migration it may be lost and/or submerged and become SS.SCS.ICS.SSh. It may also migrate along the shore and, with increased wave exposure, the area of this habitat may increase elsewhere, although it may be lost from the site of interest. Therefore, under the middle emission scenario (ca 50 cm rise) a proportion of the habitat could be lost (based on Fujii & Raffaelli, 2008) and resistance is assessed as ‘Medium’. Pethick & Crooks (2000) suggested that shingle ridges could return in 1-10 years after an extreme storm event. However, sea-level rise is an ongoing pressure and no recovery is likely, therefore, resilience is assessed as ‘Very low’ and sensitivity as ‘Medium’. Similarly, under both the high emission scenario (70 cm) and the extreme scenario (107 cm), resistance is probably ‘Low’ (a 25-75% loss), so that resilience is assessed as ‘Very low’ and sensitivity as ‘High’. However, there is likely to be considerable variation between sites (e.g. Galbraith et al., 2002; Mossman et al., 2015; Lowe et al., 2018; Palmer et al., 2018) so confidence in the assessments is ‘Low’. | LowHelp | Very LowHelp | HighHelp |
Sea level rise (high) [Show more]Sea level rise (high)High emission scenario benchmark: a 70 cm rise in average UK by the end of this century (2018-2100). Further detail. EvidenceA rise in sea level increases the water depth at the shore and results in increased wave and tidal energy along the shore, due to the increase in fetch and reduction in wave attenuation (Pethick, 2001; Crooks, 2004; Fujii, 2012). As a result, coastal landforms (e.g. subtidal bedforms, intertidal flats, saltmarshes, shingle banks, sand dunes, cliffs and coastal lowlands) migrate along and parallel to the shore to maintain their position with the coastal energy gradient (Cooks, 2004; Fujii, 2012). For example, mudflats migrate landwards to a lower energy position and may be replaced by sand flats that have themselves migrated landwards from exposed conditions (Crooks, 2004). In effect, ‘coastal roll-over’ results as the shore moves landwards by the erosion of the landward, upper limit of the shore and deposition at its lower limit (Crooks, 2004). Pethick (2001) suggested that a sea-level rise rate of 6 mm/yr could result in landward movement of estuaries by 10 m/yr, long-shore migration of open coast landforms of 50 m/yr and ebb-tidal deltas to extend laterally by 300 m/yr. For example in Norfolk, the coarse sediment beaches of Scolt Head Wells were predicted to be replaced by mudflats and saltmarsh, while sand beaches were predicted to replace salt marsh and sand dune area of Thornham, Scolt and Stiffkey (Pethick, 2001). However, many shores will not be able to move landward, either due to natural barriers (e.g. rock or cliff) or artificial structures (e.g. roadways, sea defences), resulting in ‘coastal squeeze’ and the potential substantial loss of intertidal habitat (Fujii, 2012; Mossman et al., 2015). Increased water depth and increased wave action may change to the shore from a dissipative to reflective morphology with a steeper slope and coarser sediment but lower biomass (Fujii, 2012). For example, 61% of 1084 shore profiles in England and Wales had already experienced steepening since the mid-19th century due to foreshore erosion and flood defences (Taylor et al., 2014; Fujii, 2012). Fujii & Raffaelli (2008) modelled the likely effects of sea-level rise on the Humber estuary. They suggested that sea–level rises of 10 cm, 30 cm, and 50 cm would result in loss of 2.2%, 6.7% and 11.2% of the intertidal area (including mud and sand flats), and when beach steepening and sediment shifts were taken into account, loss in macrobenthos of 6.7, 11.6 and 11.9% respectively. They concluded that a 30 cm increase in sea-level could result in an overall loss in the macrobenthos of 22.8% (Fujii & Raffaelli, 2008). Galbraith et al. (2002) modelled the effect of sea-level rise at five wetland sites in the USA on tidal flats (mud and sand). They suggested that sea-level rise produced by a 2°C change (predicted as 34-77 cm by 2100) in the USA, could result in a 20-70% loss of current intertidal area at four of the sites examined, although there was variation between sites (Galbraith et al., 2002). The effects of sea-level rise and increased wave action may be increased further due to storms and storms surges. IPCC (2019) note that the frequency of extreme sea-level events (e.g. due to storm) was predicted to increase as sea-level rises. However, there is no consensus on the future storm and wave climate around UK coasts (Mossman et al., 2015; Lowe et al., 2018; Palmer et al., 2018). Sensitivity assessment. This is a physical habitat dominated by shingle, gravel, cobbles and pebbles (JNCC, 2015). It is found from the upper to lower shore, depending on wave exposure and subject to a high level of abrasion due to sediment mobility. The evidence suggests that sea-level rise could result in landward migration of the habitat as the upper reaches of the shore are eroded and the lower reaches submerged. However, where hard structures (e.g. cliffs, sea defences) prevent landward migration it may be lost and/or submerged and become SS.SCS.ICS.SSh. It may also migrate along the shore and, with increased wave exposure, the area of this habitat may increase elsewhere, although it may be lost from the site of interest. Therefore, under the middle emission scenario (ca 50 cm rise) a proportion of the habitat could be lost (based on Fujii & Raffaelli, 2008) and resistance is assessed as ‘Medium’. Pethick & Crooks (2000) suggested that shingle ridges could return in 1-10 years after an extreme storm event. However, sea-level rise is an ongoing pressure and no recovery is likely, therefore, resilience is assessed as ‘Very low’ and sensitivity as ‘Medium’. Similarly, under both the high emission scenario (70 cm) and the extreme scenario (107 cm), resistance is probably ‘Low’ (a 25-75% loss), so that resilience is assessed as ‘Very low’ and sensitivity as ‘High’. However, there is likely to be considerable variation between sites (e.g. Galbraith et al., 2002; Mossman et al., 2015; Lowe et al., 2018; Palmer et al., 2018) so confidence in the assessments is ‘Low’. | LowHelp | Very LowHelp | HighHelp |
Sea level rise (middle) [Show more]Sea level rise (middle)Middle emission scenario benchmark: a 50 cm rise in average UK sea-level rise by the end of this century (2081-2100). Further detail. EvidenceA rise in sea level increases the water depth at the shore and results in increased wave and tidal energy along the shore, due to the increase in fetch and reduction in wave attenuation (Pethick, 2001; Crooks, 2004; Fujii, 2012). As a result, coastal landforms (e.g. subtidal bedforms, intertidal flats, saltmarshes, shingle banks, sand dunes, cliffs and coastal lowlands) migrate along and parallel to the shore to maintain their position with the coastal energy gradient (Cooks, 2004; Fujii, 2012). For example, mudflats migrate landwards to a lower energy position and may be replaced by sand flats that have themselves migrated landwards from exposed conditions (Crooks, 2004). In effect, ‘coastal roll-over’ results as the shore moves landwards by the erosion of the landward, upper limit of the shore and deposition at its lower limit (Crooks, 2004). Pethick (2001) suggested that a sea-level rise rate of 6 mm/yr could result in landward movement of estuaries by 10 m/yr, long-shore migration of open coast landforms of 50 m/yr and ebb-tidal deltas to extend laterally by 300 m/yr. For example in Norfolk, the coarse sediment beaches of Scolt Head Wells were predicted to be replaced by mudflats and saltmarsh, while sand beaches were predicted to replace salt marsh and sand dune area of Thornham, Scolt and Stiffkey (Pethick, 2001). However, many shores will not be able to move landward, either due to natural barriers (e.g. rock or cliff) or artificial structures (e.g. roadways, sea defences), resulting in ‘coastal squeeze’ and the potential substantial loss of intertidal habitat (Fujii, 2012; Mossman et al., 2015). Increased water depth and increased wave action may change to the shore from a dissipative to reflective morphology with a steeper slope and coarser sediment but lower biomass (Fujii, 2012). For example, 61% of 1084 shore profiles in England and Wales had already experienced steepening since the mid-19th century due to foreshore erosion and flood defences (Taylor et al., 2014; Fujii, 2012). Fujii & Raffaelli (2008) modelled the likely effects of sea-level rise on the Humber estuary. They suggested that sea–level rises of 10 cm, 30 cm, and 50 cm would result in loss of 2.2%, 6.7% and 11.2% of the intertidal area (including mud and sand flats), and when beach steepening and sediment shifts were taken into account, loss in macrobenthos of 6.7, 11.6 and 11.9% respectively. They concluded that a 30 cm increase in sea-level could result in an overall loss in the macrobenthos of 22.8% (Fujii & Raffaelli, 2008). Galbraith et al. (2002) modelled the effect of sea-level rise at five wetland sites in the USA on tidal flats (mud and sand). They suggested that sea-level rise produced by a 2°C change (predicted as 34-77 cm by 2100) in the USA, could result in a 20-70% loss of current intertidal area at four of the sites examined, although there was variation between sites (Galbraith et al., 2002). The effects of sea-level rise and increased wave action may be increased further due to storms and storms surges. IPCC (2019) note that the frequency of extreme sea-level events (e.g. due to storm) was predicted to increase as sea-level rises. However, there is no consensus on the future storm and wave climate around UK coasts (Mossman et al., 2015; Lowe et al., 2018; Palmer et al., 2018). Sensitivity assessment. This is a physical habitat dominated by shingle, gravel, cobbles and pebbles (JNCC, 2015). It is found from the upper to lower shore, depending on wave exposure and subject to a high level of abrasion due to sediment mobility. The evidence suggests that sea-level rise could result in landward migration of the habitat as the upper reaches of the shore are eroded and the lower reaches submerged. However, where hard structures (e.g. cliffs, sea defences) prevent landward migration it may be lost and/or submerged and become SS.SCS.ICS.SSh. It may also migrate along the shore and, with increased wave exposure, the area of this habitat may increase elsewhere, although it may be lost from the site of interest. Therefore, under the middle emission scenario (ca 50 cm rise) a proportion of the habitat could be lost (based on Fujii & Raffaelli, 2008) and resistance is assessed as ‘Medium’. Pethick & Crooks (2000) suggested that shingle ridges could return in 1-10 years after an extreme storm event. However, sea-level rise is an ongoing pressure and no recovery is likely, therefore, resilience is assessed as ‘Very low’ and sensitivity as ‘Medium’. Similarly, under both the high emission scenario (70 cm) and the extreme scenario (107 cm), resistance is probably ‘Low’ (a 25-75% loss), so that resilience is assessed as ‘Very low’ and sensitivity as ‘High’. However, there is likely to be considerable variation between sites (e.g. Galbraith et al., 2002; Mossman et al., 2015; Lowe et al., 2018; Palmer et al., 2018) so confidence in the assessments is ‘Low’. | MediumHelp | Very LowHelp | MediumHelp |
Hydrological Pressures
Use [show more] / [show less] to open/close text displayed
| Resistance | Resilience | Sensitivity | |
Temperature increase (local) [Show more]Temperature increase (local)Benchmark. A 5°C increase in temperature for one month, or 2°C for one year. Further detail EvidenceThis biotope is characterized by the absence of species resulting from sediment mobility and abrasion (JNCC, 2015), rather than the presence of typical species. Therefore, changes in temperature will not alter the biotope as it is defined by the abiotic habitat. Hence, resistance to an increase in temperature is assessed as 'High' and resilience as ‘High’ (by default) and this biotope is assessed as 'Not sensitive'. | HighHelp | HighHelp | Not sensitiveHelp |
Temperature decrease (local) [Show more]Temperature decrease (local)Benchmark. A 5°C decrease in temperature for one month, or 2°C for one year. Further detail EvidenceThis biotope is characterized by the absence of species resulting from sediment mobility and abrasion (JNCC, 2015), rather than the presence of typical species. Therefore, changes in temperature will not alter the biotope as it is defined by the abiotic habitat. Hence, resistance to an increase in temperature is assessed as 'High' and resilience as ‘High’ (by default) and this biotope is assessed as 'Not sensitive'. | HighHelp | HighHelp | Not sensitiveHelp |
Salinity increase (local) [Show more]Salinity increase (local)Benchmark. A increase in one MNCR salinity category above the usual range of the biotope or habitat. Further detail EvidenceThis biotope is characterized by the absence of species resulting from sediment mobility and abrasion (JNCC, 2015), rather than the presence of typical species: changes in salinity will therefore not alter the biotope (based on the abiotic habitat). Resistance to an increase in salinity is therefore assessed as 'High' and resilience as ‘High’ (by default) and this biotope is considered to be 'Not sensitive'. | HighHelp | HighHelp | Not sensitiveHelp |
Salinity decrease (local) [Show more]Salinity decrease (local)Benchmark. A decrease in one MNCR salinity category above the usual range of the biotope or habitat. Further detail EvidenceThis biotope is characterized by the absence of species resulting from sediment mobility and abrasion (JNCC, 2015), rather than the presence of typical species: changes in salinity will therefore not alter the biotope (based on the abiotic habitat). Resistance to a decrease in salinity is therefore assessed as 'High' and resilience as ‘High’ (by default) and this biotope is considered to be 'Not sensitive'. | HighHelp | HighHelp | Not sensitiveHelp |
Water flow (tidal current) changes (local) [Show more]Water flow (tidal current) changes (local)Benchmark. A change in peak mean spring bed flow velocity of between 0.1 m/s to 0.2 m/s for more than one year. Further detail EvidenceChanges in water flow at the pressure benchmark are considered unlikely to lead to alterations in the biotope as wave exposure would still result in sediment mobility, preventing the establishment of a more species rich biotope. Resistance is therefore assessed as ‘High’ and resilience as ‘High’ (by default) so that the biotope is considered to be ‘Not sensitive’. | HighHelp | HighHelp | Not sensitiveHelp |
Emergence regime changes [Show more]Emergence regime changesBenchmark. 1) A change in the time covered or not covered by the sea for a period of ≥1 year or 2) an increase in relative sea level or decrease in high water level for ≥1 year. Further detail EvidenceThis biotope occurs from the lower to upper shore and sediment mobility, rather than emergence, is a key factor preventing the establishment of a more species rich biotope. An increase in the emergence period of this biotope would make it even more inhospitable to marine invertebrates. Where the biotope occurs in the supralittoral zone, a reduction in saline spray and splash may favour the colonization of terrestrial plants, which if able fully to establish will have a stabilising effect on the substratum. Consequently, this factor has the potential to alter the biotope. Similarly a decrease in emergence that led to this biotope becoming fully sublittoral would result in reclassification (most likely to the biotope SS.SCS.ICS.SSh). The LS.LCS.Sh.BarSh biotope would not be recognized in either scenario and resistance has therefore been assessed as ‘Low’. On return to prior emergence regime sublittoral species that are intolerant of emergence and plants that may have colonized the substratum and which are intolerant to saline splash and spray will probably decline rapidly. Therefore resilience has been assessed as ‘High’. This biotope is therefore considered to have ‘Low’ sensitivity’ to changes in emergence. | LowHelp | HighHelp | LowHelp |
Wave exposure changes (local) [Show more]Wave exposure changes (local)Benchmark. A change in near shore significant wave height of >3% but <5% for more than one year. Further detail EvidenceThis biotope is found on shores that are judged to be moderately exposed or exposed (JNCC, 2015). The presence of this biotope across these two categories is considered to indicate (by proxy) that increases or decreases in wave exposure at the pressure benchmark are unlikely to lead to alterations to the biotope. Resistance is therefore assessed as ‘High’ and resilience as ‘High’ (by default) so that the biotope is considered to be ‘Not sensitive’. | HighHelp | HighHelp | Not sensitiveHelp |
Chemical Pressures
Use [show more] / [show less] to open/close text displayed
| Resistance | Resilience | Sensitivity | |
Transition elements & organo-metal contamination [Show more]Transition elements & organo-metal contaminationBenchmark. Exposure of marine species or habitat to one or more relevant contaminants via uncontrolled releases or incidental spills. Further detail EvidenceThis pressure is Not assessed but evidence is presented where available. As this biotope is characterized by the lack of species, exposure to contaminants will not result in significant impacts. | Not Assessed (NA)Help | Not assessed (NA)Help | Not assessed (NA)Help |
Hydrocarbon & PAH contamination [Show more]Hydrocarbon & PAH contaminationBenchmark. Exposure of marine species or habitat to one or more relevant contaminants via uncontrolled releases or incidental spills. Further detail EvidenceThis pressure is Not assessed but evidence is presented where available. As this biotope is characterized by the lack of species, exposure to contaminants will not result in significant impacts. Small amounts of oil that can persist for decades in the intertidal zone of coarse-sediment beaches have been documented in a few well-studied cases (Owens et al. 2008). Oil that survives attenuation over the short-term (weeks to months) will persist until there is a change in the environmental conditions, as might occur where there is a seasonal storm-wave climate or as a beach undergoes long-term (erosional) changes. Oil residues can persist on the beach surface as tar mats, asphalt-like pavements, or as veneers on sediment particles or hard surfaces. Subsurface oil residues can persist in similar forms or as fill or partial fill of the pore spaces between coarse-sediment particles. Oil penetrates until it reaches fine-grained sediment, the water table, bedrock, or other penetration-limiting layers. Amounts of persistent oil are very small fractions of the volumes that were originally stranded and these protected residues can continue to biodegrade as they become thinner and more discontinuous. | Not Assessed (NA)Help | Not assessed (NA)Help | Not assessed (NA)Help |
Synthetic compound contamination [Show more]Synthetic compound contaminationBenchmark. Exposure of marine species or habitat to one or more relevant contaminants via uncontrolled releases or incidental spills. Further detail EvidenceThis pressure is Not assessed but evidence is presented where available. As this biotope is characterized by the lack of species, exposure to contaminants will not result in significant impacts. | Not Assessed (NA)Help | Not assessed (NA)Help | Not assessed (NA)Help |
Radionuclide contamination [Show more]Radionuclide contaminationBenchmark. An increase in 10µGy/h above background levels. Further detail EvidenceNot evidence was found. | No evidence (NEv)Help | Not relevant (NR)Help | No evidence (NEv)Help |
Introduction of other substances [Show more]Introduction of other substancesBenchmark. Exposure of marine species or habitat to one or more relevant contaminants via uncontrolled releases or incidental spills. Further detail EvidenceThis pressure is Not assessed. | Not Assessed (NA)Help | Not assessed (NA)Help | Not assessed (NA)Help |
De-oxygenation [Show more]De-oxygenationBenchmark. Exposure to dissolved oxygen concentration of less than or equal to 2 mg/l for one week (a change from WFD poor status to bad status). Further detail EvidenceAs this biotope is characterized by the lack of species, de-oxygenation will not result in significant impacts. De-oxygenation is unlikely as this biotope is intertidal and exposure to air and tidal flushing is likely to recharge oxygen levels. Biotope resistance is therefore assessed as 'High', and resilience as 'High' (by default) and the biotope is considered to be 'Not sensitive'. | HighHelp | HighHelp | Not sensitiveHelp |
Nutrient enrichment [Show more]Nutrient enrichmentBenchmark. Compliance with WFD criteria for good status. Further detail EvidenceAs this biotope is characterized by the lack of species present due to sediment mobility, nutrient enrichment will not result in significant impacts. Biotope resistance is therefore assessed as 'High', and resilience as 'High' (by default) and the biotope is considered to be 'Not sensitive'. | HighHelp | HighHelp | Not sensitiveHelp |
Organic enrichment [Show more]Organic enrichmentBenchmark. A deposit of 100 gC/m2/yr. Further detail EvidenceAs this biotope is characterized by the lack of species, organic enrichment will not result in significant impacts. Organic deposits are likely to be removed rapidly by wave action although in periods of calm an organic deposit may be rapidly colonized by oligochaetes or amphipods. Biotope resistance is assessed as 'High' as enrichment is likely to be very short-lived, and resilience as 'High' (by default), the biotope is considered to be 'Not sensitive'. | HighHelp | HighHelp | Not sensitiveHelp |
Physical Pressures
Use [show more] / [show less] to open/close text displayed
| Resistance | Resilience | Sensitivity | |
Physical loss (to land or freshwater habitat) [Show more]Physical loss (to land or freshwater habitat)Benchmark. A permanent loss of existing saline habitat within the site. Further detail EvidenceAll marine habitats and benthic species are considered to have a resistance of ‘None’ to this pressure and to be unable to recover from a permanent loss of habitat (resilience is ‘Very Low’). Sensitivity within the direct spatial footprint of this pressure is therefore ‘High’. Although no specific evidence is described confidence in this assessment is ‘High’, due to the incontrovertible nature of this pressure. | NoneHelp | Very LowHelp | HighHelp |
Physical change (to another seabed type) [Show more]Physical change (to another seabed type)Benchmark. Permanent change from sedimentary or soft rock substrata to hard rock or artificial substrata or vice-versa. Further detail EvidenceThis biotope is characterized by coarse sands (JNCC, 2015). A change to a hard or artificial substratum would significantly alter the character of the biotope. The biotope is therefore considered to have 'No' resistance to this pressure (based on a change to a sediment habitat), recovery is assessed as 'Very low', as the change at the pressure benchmark is permanent. Biotope sensitivity is therefore assessed as 'High'. | NoneHelp | Very LowHelp | HighHelp |
Physical change (to another sediment type) [Show more]Physical change (to another sediment type)Benchmark. Permanent change in one Folk class (based on UK SeaMap simplified classification). Further detail EvidenceThe benchmark for this pressure refers to a change in one Folk class. The pressure benchmark originally developed by Tillin et al., (2010) used the modified Folk triangle developed by Long (2006) which simplified sediment types into four categories: mud and sandy mud, sand and muddy sand, mixed sediments and coarse sediments. The change referred to is therefore a change in sediment classification rather than a change in the finer-scale original Folk categories (Folk, 1954). The change in one Folk class is considered to relate to a change in classification to adjacent categories in the modified Folk triangle. For shingle habitats a change in one folk class may refer to a change to gravels, mixed sediments or muddy sands, sandy muds and muds. A change in sediment type would result in reclassification of the biotope (JNCC, 2015) and a change to mixed or fine sediments would likely result in the establishment of a species rich and more diverse community (depending on other habitat factors). Biotope resistance is therefore assessed as ‘None’ and resilience as ‘Very low’ as the change at the pressure benchmark is permanent. Sensitivity is therefore ‘High’. | NoneHelp | Very LowHelp | HighHelp |
Habitat structure changes - removal of substratum (extraction) [Show more]Habitat structure changes - removal of substratum (extraction)Benchmark. The extraction of substratum to 30 cm (where substratum includes sediments and soft rock but excludes hard bedrock). Further detail EvidenceThe process of extraction will remove the abiotic habitat; therefore a resistance of ‘None’ is recorded. As the shingle is mobile where small areas are impacted infilling is likely to be rapid following sediment redistribution by wave action. For instance, at Village Bay on St Kilda, an island group far out into the Atlantic west of Britain, an expanse of sandy beach was removed offshore as a result of winter storms to reveal an underlying rocky shore (Scott, 1960). Yet in the following summer the beach was gradually replaced when wave action was less severe. In view of such observations, that many sandy beaches disappear in winter and reappear in spring, it is likely that recovery would occur in less than a year or six months. As a result, resilience is assessed as ‘High’, and sensitivity as ‘Medium’. Recovery where large volumes of shingle are removed over wide areas may lead to slower recovery if sediments are not available and/or water transport is limited. | NoneHelp | HighHelp | MediumHelp |
Abrasion / disturbance of the surface of the substratum or seabed [Show more]Abrasion / disturbance of the surface of the substratum or seabedBenchmark. Damage to surface features (e.g. species and physical structures within the habitat). Further detail EvidenceThis biotope is characterized by the absence of species through sediment mobility (JNCC, 2015), rather than the presence of typical species: abrasion will therefore not alter biotope character. The highly mobile species present occasionally in this biotope may only be found in extremely low abundance and are not specifically dependent on this biotope. Resistance to this pressure is therefore assessed as 'High' and resilience as ‘High’ (by default) and this biotope is considered to be 'Not sensitive'. | HighHelp | HighHelp | Not sensitiveHelp |
Penetration or disturbance of the substratum subsurface [Show more]Penetration or disturbance of the substratum subsurfaceBenchmark. Damage to sub-surface features (e.g. species and physical structures within the habitat). Further detail EvidenceThis biotope is characterized by the absence of species through sediment mobility (JNCC, 2015), rather than the presence of typical species: abrasion will therefore not alter biotope character. The highly mobile species present occasionally in this biotope may only be found in extremely low abundance and are not specifically dependent on this biotope Resistance to this pressure is therefore assessed as 'High' and resilience as ‘High’ (by default) and this biotope is considered to be 'Not sensitive'. | HighHelp | HighHelp | Not sensitiveHelp |
Changes in suspended solids (water clarity) [Show more]Changes in suspended solids (water clarity)Benchmark. A change in one rank on the WFD (Water Framework Directive) scale e.g. from clear to intermediate for one year. Further detail EvidenceThis biotope occurs in scoured habitats and it is likely, depending on local sediment supply, that the biotope is exposed to chronic or intermittent episodes of high-levels of suspended solids as local sediments are re-mobilised and transported by wave action. This biotope is characterized by the absence of species through sediment mobility (JNCC, 2015), rather than the presence of typical species: changes in suspended solids will therefore not alter the biotope. Resistance to an increase or decrease in suspended solids is therefore assessed as 'High' and resilience as ‘High’ (by default) and this biotope is considered to be 'Not sensitive'. | HighHelp | HighHelp | Not sensitiveHelp |
Smothering and siltation rate changes (light) [Show more]Smothering and siltation rate changes (light)Benchmark. ‘Light’ deposition of up to 5 cm of fine material added to the seabed in a single discrete event. Further detail EvidenceThis biotope is characterized by the absence of species through sediment mobility (JNCC, 2015), rather than the presence of typical species: the addition of a single deposit of fine sediments which will be removed by wave action will therefore not alter the biotope. Resistance to this pressure is therefore assessed as 'High' and resilience as ‘High’ (by default) and this biotope is considered to be 'Not sensitive'. | HighHelp | HighHelp | Not sensitiveHelp |
Smothering and siltation rate changes (heavy) [Show more]Smothering and siltation rate changes (heavy)Benchmark. ‘Heavy’ deposition of up to 30 cm of fine material added to the seabed in a single discrete event. Further detail EvidenceThis biotope is characterized by the absence of species through sediment mobility (JNCC, 2015), rather than the presence of typical species: the addition of a single deposit of fine sediments which will be removed by wave action will therefore not alter the biotope. Resistance to this pressure is therefore assessed as 'High' and resilience as ‘High’ (by default) and this biotope is considered to be 'Not sensitive'. | HighHelp | HighHelp | Not sensitiveHelp |
Litter [Show more]LitterBenchmark. The introduction of man-made objects able to cause physical harm (surface, water column, seafloor or strandline). Further detail EvidenceNot assessed. | Not Assessed (NA)Help | Not assessed (NA)Help | Not assessed (NA)Help |
Electromagnetic changes [Show more]Electromagnetic changesBenchmark. A local electric field of 1 V/m or a local magnetic field of 10 µT. Further detail EvidenceNot evidence | No evidence (NEv)Help | Not relevant (NR)Help | No evidence (NEv)Help |
Underwater noise changes [Show more]Underwater noise changesBenchmark. MSFD indicator levels (SEL or peak SPL) exceeded for 20% of days in a calendar year. Further detail EvidenceNot relevant. | Not relevant (NR)Help | Not relevant (NR)Help | Not relevant (NR)Help |
Introduction of light or shading [Show more]Introduction of light or shadingBenchmark. A change in incident light via anthropogenic means. Further detail EvidenceNot relevant. | Not relevant (NR)Help | Not relevant (NR)Help | Not relevant (NR)Help |
Barrier to species movement [Show more]Barrier to species movementBenchmark. A permanent or temporary barrier to species movement over ≥50% of water body width or a 10% change in tidal excursion. Further detail EvidenceNot relevant. | Not relevant (NR)Help | Not relevant (NR)Help | Not relevant (NR)Help |
Death or injury by collision [Show more]Death or injury by collisionBenchmark. Injury or mortality from collisions of biota with both static or moving structures due to 0.1% of tidal volume on an average tide, passing through an artificial structure. Further detail EvidenceNot relevant’ to seabed habitats. NB. Collision by grounding vessels is addressed under surface abrasion. | Not relevant (NR)Help | Not relevant (NR)Help | Not relevant (NR)Help |
Visual disturbance [Show more]Visual disturbanceBenchmark. The daily duration of transient visual cues exceeds 10% of the period of site occupancy by the feature. Further detail EvidenceNot relevant. | Not relevant (NR)Help | Not relevant (NR)Help | Not relevant (NR)Help |
Biological Pressures
Use [show more] / [show less] to open/close text displayed
| Resistance | Resilience | Sensitivity | |
Genetic modification & translocation of indigenous species [Show more]Genetic modification & translocation of indigenous speciesBenchmark. Translocation of indigenous species or the introduction of genetically modified or genetically different populations of indigenous species that may result in changes in the genetic structure of local populations, hybridization, or change in community structure. Further detail EvidenceThis biotope is not characterized by any typical species, those that are present, such as Bathyporeia spp. are not translocated and this pressure is therefore considered 'Not relevant'. | Not relevant (NR)Help | Not relevant (NR)Help | Not relevant (NR)Help |
Introduction of microbial pathogens [Show more]Introduction of microbial pathogensBenchmark. The introduction of relevant microbial pathogens or metazoan disease vectors to an area where they are currently not present (e.g. Martelia refringens and Bonamia, Avian influenza virus, viral Haemorrhagic Septicaemia virus). Further detail EvidenceAs this biotope is characterized by the absence of a biological assemblage apart from occasional and ephemeral presence of amphipods or other species deposited by an ebbing tide (JNCC, 2015), this pressure is considered to be 'Not relevant'. | Not relevant (NR)Help | Not relevant (NR)Help | Not relevant (NR)Help |
Removal of target species [Show more]Removal of target speciesBenchmark. Removal of species targeted by fishery, shellfishery or harvesting at a commercial or recreational scale. Further detail EvidenceAs this biotope is characterized by the absence of a biological assemblage apart from occasional and ephemeral presence of amphipods or other species deposited by the ebbing tide (JNCC, 2015), this pressure is considered to be 'Not relevant'. | Not relevant (NR)Help | Not relevant (NR)Help | Not relevant (NR)Help |
Removal of non-target species [Show more]Removal of non-target speciesBenchmark. Removal of features or incidental non-targeted catch (by-catch) through targeted fishery, shellfishery or harvesting at a commercial or recreational scale. Further detail EvidenceAs this biotope is characterized by the absence of a biological assemblage apart from occasional and ephemeral presence of species deposited by an ebbing tide (JNCC, 2015), this pressure is considered to be 'Not relevant'. | Not relevant (NR)Help | Not relevant (NR)Help | Not relevant (NR)Help |
Introduction or spread of invasive non-indigenous species (INIS) Pressures
Use [show more] / [show less] to open/close text displayed
| Resistance | Resilience | Sensitivity | |
Other INIS [Show more]Other INISEvidenceThe high levels of abrasion resulting from the movement of shingle and the subsequent sediment instability will limit the establishment of all but the most highly scour-resistant invasive non-indigenous species (INIS) and no direct evidence was found for the effects of INIS on this biotope. The low levels of water and organic matter retained by this biotope, are considered to inhibit permanent colonization by invasive species. Overall, there is no evidence of this biotope being adversely affected by non-native species. | Not relevant (NR)Help | Not relevant (NR)Help | Not relevant (NR)Help |
Bibliography
Bird, E.C.F., 1983. Factors influencing beach and accretion: a global review. In Sandy beaches as ecosystems(ed. A. McLachlan & T. Erasmus), pp. 709-717. The Hague: Dr W. Junk Publishers.
Connor, D.W., Allen, J.H., Golding, N., Howell, K.L., Lieberknecht, L.M., Northen, K.O. & Reker, J.B., 2004. The Marine Habitat Classification for Britain and Ireland. Version 04.05. ISBN 1 861 07561 8. In JNCC (2015), The Marine Habitat Classification for Britain and Ireland Version 15.03. [2019-07-24]. Joint Nature Conservation Committee, Peterborough. Available from https://mhc.jncc.gov.uk/
Connor, D.W., Brazier, D.P., Hill, T.O., & Northen, K.O., 1997b. Marine biotope classification for Britain and Ireland. Vol. 1. Littoral biotopes. Joint Nature Conservation Committee, Peterborough, JNCC Report no. 229, Version 97.06., Joint Nature Conservation Committee, Peterborough, JNCC Report No. 230, Version 97.06.
Crooks, S., 2004. The effect of sea-level rise on coastal geomorphology. Ibis, 146 (s1), 18-20. DOI https://doi.org/10.1111/j.1474-919X.2004.00323.x
Fish, J.D. & Fish, S., 1996. A student's guide to the seashore. Cambridge: Cambridge University Press.
Fish, J.D. & Preece, G.S., 1970. The annual reproductive patterns of Bathyporeia pilosa and Bathyporeia pelagica (Crustacea: Amphipoda). Journal of the Marine Biological Association of the United Kingdom, 50, 475-488.
Fish, S., 1970. The biology of Eurydice pulchra (Crustacea: Isopoda). Journal of the Marine Biological Association of the United Kingdom, 50, 753-768.
Fujii, T. & Raffaelli, D., 2008. Sea-level rise, expected environmental changes, and responses of intertidal benthic macrofauna in the Humber estuary, UK. Marine Ecology Progress Series, 371, 23-35. DOI https://doi.org/10.3354/meps07652
Fujii, T., 2012. Climate Change, Sea-Level Rise and Implications for Coastal and Estuarine Shoreline Management with Particular Reference to the Ecology of Intertidal Benthic Macrofauna in NW Europe. Biology and Environment. Proceedings of the Royal Irish Academy, Section B,, 1, 597-616. DOI https://doi.org/10.3390/biology1030597
Galbraith, H., Jones, R., Park, R., Clough, J., Herrod-Jules, S., Harrington, B. & Page, G., 2005. Global climate change and sea level rise: potential losses of intertidal habitats for shorebirds. USDA Forest Service General Technical Reports PSW-GTR-191, USDA Forest Service, pp. 1119-1122. Available from https://www.fs.fed.us/psw/publications/documents/psw_gtr191/psw_gtr191_1119-1122_galbraith.pdf
Hayward, P.J. 1994. Animals of sandy shores. Slough, England: The Richmond Publishing Co. Ltd. [Naturalists' Handbook 21.]
IPCC (Intergovernmental Panel on Climate Change), 2019. IPCC Special Report on the Ocean and Cryosphere in a Changing Climate. Intergovernmental Panel on Climate Change, Geneva, Switzerland, 1170 pp. Available from https://www.ipcc.ch/srocc/home/
JNCC (Joint Nature Conservation Committee), 2022. The Marine Habitat Classification for Britain and Ireland Version 22.04. [Date accessed]. Available from: https://mhc.jncc.gov.uk/
JNCC (Joint Nature Conservation Committee), 1999. Marine Environment Resource Mapping And Information Database (MERMAID): Marine Nature Conservation Review Survey Database. [on-line] http://www.jncc.gov.uk/mermaid
Jones, D.A., 1970. Population densities and breeding in Eurydice pulchra and Eurydice affinis in Britain. Journal of the Marine Biological Association of the United Kingdom, 50, 635-655.
Long, D., 2006. BGS detailed explanation of seabed sediment modified Folk classification. Available from: http://www.emodnet-seabedhabitats.eu/PDF/GMHM3_Detailed_explanation_of_seabed_sediment_classification.pdf
Lowe, J., Bernie, D., Bett, P., Bricheno, L., Brown, S., Calvert, D., Clark, R.T., Eagle, K.E., Edwards, T., Fosser, G., Fung, F., Gohar, L., Good, P., Gregory, J., Harris, G.R., Howard, T., Kaye, N., Kendon, E.J., Krijnen, J., Maisey, P., McDonald, R.E., McInnes, R.N., McSweeney, C.F., Mitchell, J.F.B., Murphy, J.M., Palmer, M., Roberts, C., Rostron, J.W., Sexton, D.M.H., Thornton, H.E., Tinker, J., Tucker, S., Yamazaki, K. & Belcher, S., 2018. UKCP18 Science Overview Report. Meterological Office, Hadley Centre, Exeter, UK, 73 pp. Available from https://www.metoffice.gov.uk/research/approach/collaboration/ukcp/index
McLachlan, A., 1983. Sandy beach ecology - a review. In Sandy beaches as ecosystems (ed. A. McLachlan & T. Erasmus), pp.321-381. The Hague: Dr W. Junk Publishers.
Mossman, H.L., Grant, A., Lawrence, P.J. & Davy, A.J., 2015. Biodiversity climate change impacts report card technical paper 10. Implications of climate change for coastal and inter-tidal habitats of the UK. Biodiversity climate change impacts, Living With Environmental Change, NERC, UKRI, 26 pp. Available from https://nerc.ukri.org/research/partnerships/ride/lwec/report-cards/biodiversity-source10/
Palmer, M., Howard, T., Tinker, J., Lowe, J., Bricheno, L., Calvert, D., Edwards, T., Gregory, J., Harris, G., Krijnen, J., Pickering, M., Roberts, C. & Wolf, J., 2018. UKCP18 Marine Report. Met Office, The Hadley Centre, Exeter, UK, 133 pp. Available from https://www.metoffice.gov.uk/pub/data/weather/uk/ukcp18/science-reports/UKCP18-Marine-report.pdf
Peterson, C.H., 1991. Intertidal zonation of marine invertebrates in sand and mud. American Scientist, 79, 236-249.
Pethick, J., 2001. Coastal management and sea-level rise. Catena, 42 (2), 307-322. DOI https://doi.org/10.1016/S0341-8162(00)00143-0
Pethick, J.S. & Crooks, S., 2000. Development of a coastal vulnerability index: a geomorphological perspective. Environmental Conservation, 27 (4), 359-367. DOI https://doi.org/10.1017/S0376892900000412
Scott, A., 1960. The fauna of the sandy beach, Village Bay, St. Kilda. A dynamical relationship. Oikos, 11, 153-160.
Citation
This review can be cited as:
Last Updated: 31/10/2019
